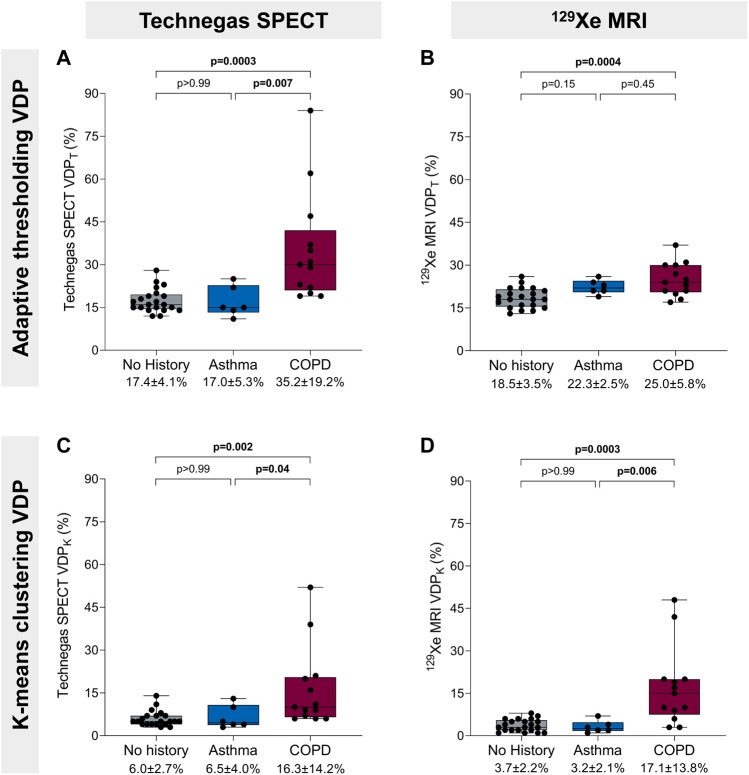
FIGURE 3.
Ventilation defect percent and history of obstructive lung disease. (A) Technegas SPECT VDPT* was higher in participants with COPD than participants with asthma (35.2% ± 19.2% vs. 17.0 ± 5.3, p = 0.007) and those with no history of lung disease (35.2% ± 19.2% vs. 17.4 ± 4.1, p = 0.0003). (B) 129Xe MRI VDPT was higher for participants with COPD than those with no history of lung disease (25.0% ± 5.8% vs. 18.5% ± 3.5%, p = 0.0004). (C) Technegas SPECT VDPK was significantly higher for participants with COPD than those with asthma (16.3% ± 14.2% vs. 6.5% ± 4.0%, p = 0.04) and no history of lung disease (16.3% ± 14.2% vs. 6.0% ± 2.7%, p = 0.002). (D) 129Xe MRI VDPK* was higher in participants with COPD than participants with asthma (17.1% ± 13.8% vs. 3.2% ± 2.1%, p = 0.006) and those with no history of lung disease (17.1% ± 13.8% vs. 3.7% ± 2.2%, p = 0.0003). Box plots show minimum, first quartile, median, third quartile, and maximum VDP with individual values for all participants superimposed on the plot. Difference between groups was determined using one-way ANOVA with Tukey’s multiple comparisons test or Kruskal Wallis with Dunn’s multiple comparisons test. *Thresholding (VDPT) and k-means clustering (VDPK) methods previously optimized and validated for Technegas SPECT and 129Xe MRI, respectively.

