Fig. 1.
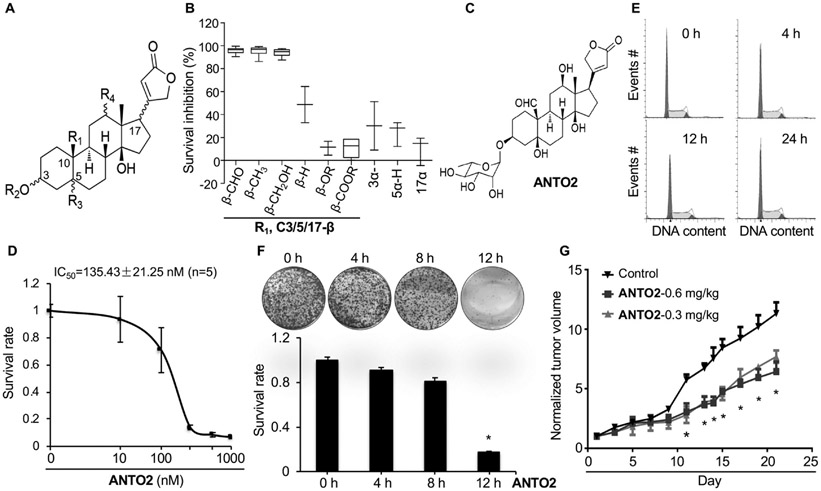
Anticancer effects of cardiac glycosides. (A) Structural backbone of 68 cardiac glycosides studied herein. (B) SAR of survival inhibition rate by cardiac glycosides in U2OS cells. 68 natural cardiac glycosides were tested and presented as the Box-Whisker plot showing 1st and 3rd quartile, based on the effects of the substitution groups. The more inhibition, the stronger the anticancer effect it has. (C) Structure of ANTO2. (D) IC50 of ANTO2 in A549 cells representing average and standard deviation from five replicates. (E) A549 cells were treated with 500 nM ANTO2 for indicated times and cell cycle profile was analyzed by FACS. (F) Clonogenic survival assay of A549 cells treated with 500 nM ANTO2 for indicated times. Data represent average and SEM from 3 replicates. (G) Effect of ANTO2 on A549 tumor growth in nude mice. Relative tumor growth is obtained by normalizing the tumor volume to that at day 1. Data represent mean and standard deviation from 10 mice per group. Two-tailed t-student test was used to determine the statistical significance. * P < 0.001 between control and ANTO2 group.

