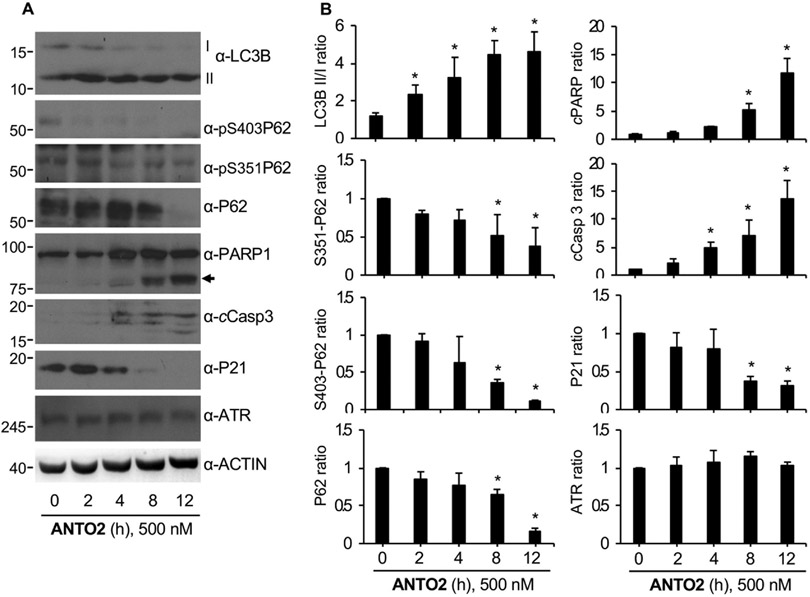
Fig. 6.
Dose-dependent response of A549 cells to ANTO2. (A) A549 cells were treated with 500 nM ANTO2 for indicated h, and protein levels were analyzed by indicated specific antibodies. Arrow indicates cleaved PARP. (B) The relative protein level ratio was quantitated and shown as average and standard deviation from three replicates. *P < 0.005 between control and treated groups.

