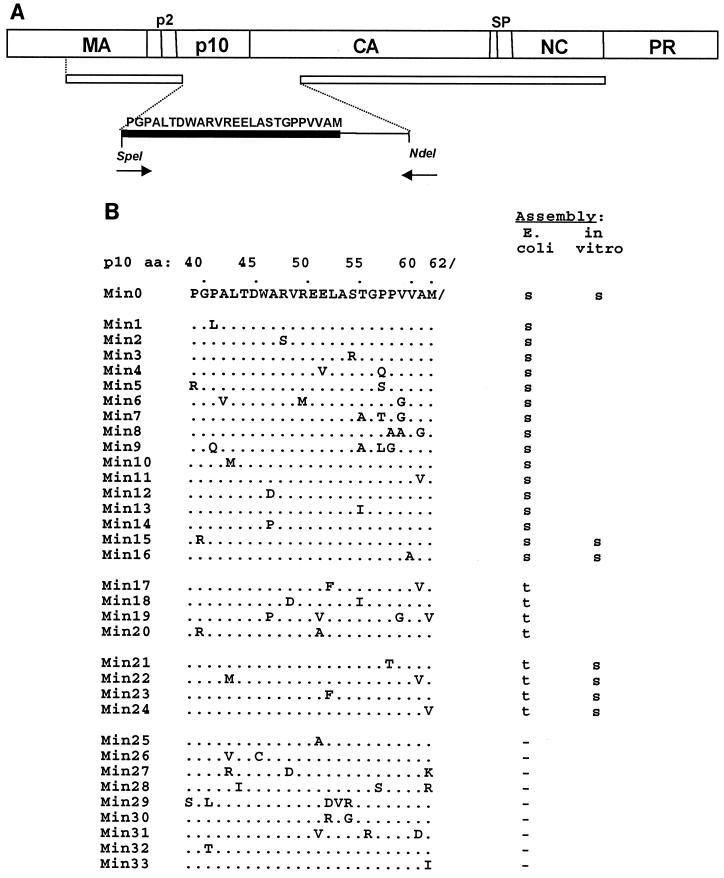
FIG. 3.
Results of random and site-directed mutagenesis. (A) Mutagenesis strategy. A schematic diagram shows the PCR strategy for the partial-randomization experiment. The top bar represents the Gag polyprotein. The second, narrower bar denotes the ΔMBDdp10 protein; the gap is at the SpeI site. The forward primer starts at the corresponding SpeI site; the reverse primer starts at the natural NdeI site for the CA gene. The sequence that is shown (thick black bar) was partially randomized. The methionine at the end of this sequence is the C-terminal residue of the wild-type p10 protein. (B) Mutant sequences and assembly phenotypes. Dots denote the wild-type sequence, with changes from the wild-type sequence shown by letters. The results are for particles observed in crude lysates and for some particles assembled in vitro from purified proteins. Blanks indicate that the protein was not tested. s, spheres; t, tubes; −, no assembly.

