
Figure 10.
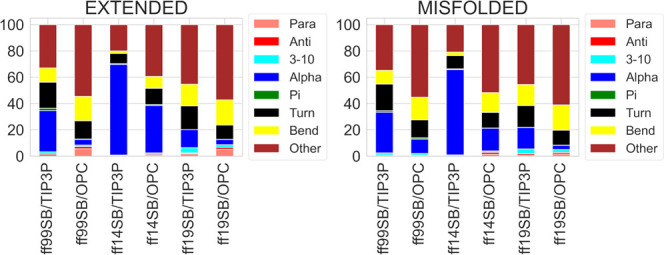
DSSP analysis of B3 trajectories from extended and misfolded simulations. Values are expressed as a percentage of the distributions of all the residues considering the last 500 ns frames.
Official websites use .gov
A
.gov website belongs to an official
government organization in the United States.
Secure .gov websites use HTTPS
A lock (
) or https:// means you've safely
connected to the .gov website. Share sensitive
information only on official, secure websites.
DSSP analysis of B3 trajectories from extended and misfolded simulations. Values are expressed as a percentage of the distributions of all the residues considering the last 500 ns frames.