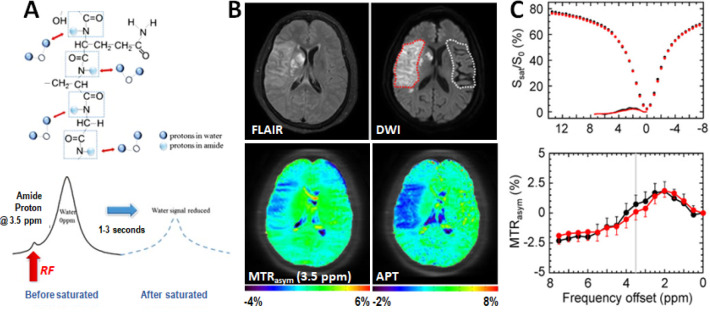
Figure 10.
(A) Schematic illustration of the CEST imaging of slow exchange of hydrogen-bound water on amide protons and bulk water. An example of APT imaging of an acute stroke patient with right MCA occlusion106 (B) with conventional FLAIR and DWI images (top) showing the ischemic region. MTR asymmetry analysis and APT (bottom) showed much clearer ischemic contrasts than MTRasym (3.5 ppm). (C) Z-spectra and MTRasym spectra were obtained from the contralateral normal (black) and the ischemic lesion (red). B, C: Adapted with permission from ref (106). Copyright 2017 International Society for Magnetic Resonance in Medicine and Wiley.

