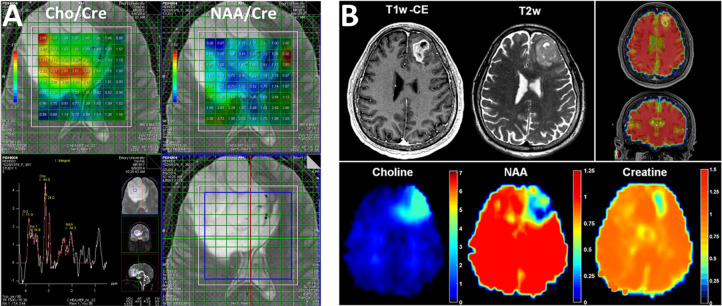
Figure 4.
Maps of the rations of NAA vs Cre and Cho vs Cre derived from multivoxel MRSI or CSI of a brain tumor (A) show the intratumoral heterogeneity of metabolic changes with highly elevated Cho and reduced NAA in relation to Cre in the specific regions that cannot be localized well in T2-weighted MRI. Composed from unpublished data. (B) Whole-brain CSI performed on a recurring GBM identified areas with tumor cells infiltrating beyond the boundary delineated in T2-weighted (T2w) and T1-weighted contrast-enhanced (T1w-CE) MRI. Reprinted in part with permission from ref (47). Copyright 2016 Society for Neuro-Oncology and Oxford University Press.

