Fig. 4.
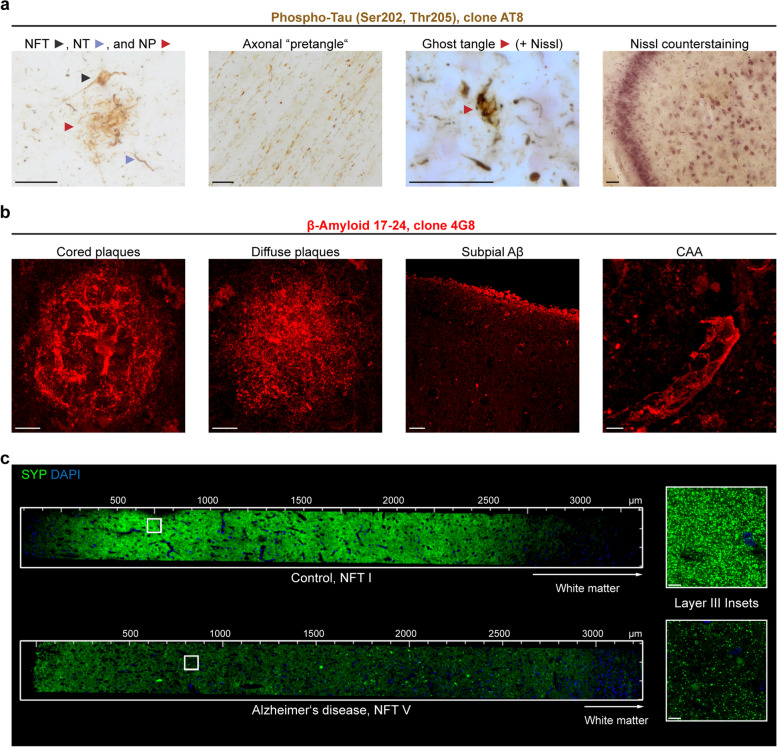
Hallmarks of Alzheimer’s disease and synaptic decline throughout the six cortical layers after CLARITY. a 100 µm-thick polyethylene glycol (PEG) sections (tissue bank, NFT stage V, Aβ phase 4, PD stage 3) were collected in 70% ethanol after cutting and washed in water before starting with the CLARITY protocol. Following the clearing step, traditional DAB-based immunolabeling was performed against phospho-tau (clone AT8). Different kinds of tau aggregates could be identified. Ghost tangles required counterstaining for Nissl substance with Darrow red. All images were acquired with a BX61 microscope (Olympus Optical) using extended focal imaging (EFI). On the far right, a cleared hippocampal section from a perfusion-fixed case is shown after AT8 staining (DAB) and Nissl counterstaining. The 2D image was acquired with a Biorevo BZ-X810 microscope. NFT = neurofibrillary tangle, NT = neuropil thread, NP = neuritic plaque. Scale bars, 50 µm. b Different types of Aβ pathology were detected following immunolabeling (clone 4G8) after CLARITY (perfusion-fixed case). CAA = cerebral amyloid angiopathy. Scale bars, from left to right, 10 µm, 10 µm, 50 µm, 5 µm. Except the third image from left, all images represent maximum intensity projections (MIPs) of z-stacks. c Staining of comparable cortex sections (superior frontal gyrus, Brodmann area 9) with synaptophysin (SYP, G2 in Table 2) reveals the drastic decline in synaptic density between a control case (case p2, NFT stage I) and a clinically diagnosed Alzheimer’s case (NFT stage V). Both sections were derived from perfusion-fixed cases. The insets to the right show a magnification of the most heavily affected layer III. Scale bars, 8 µm

