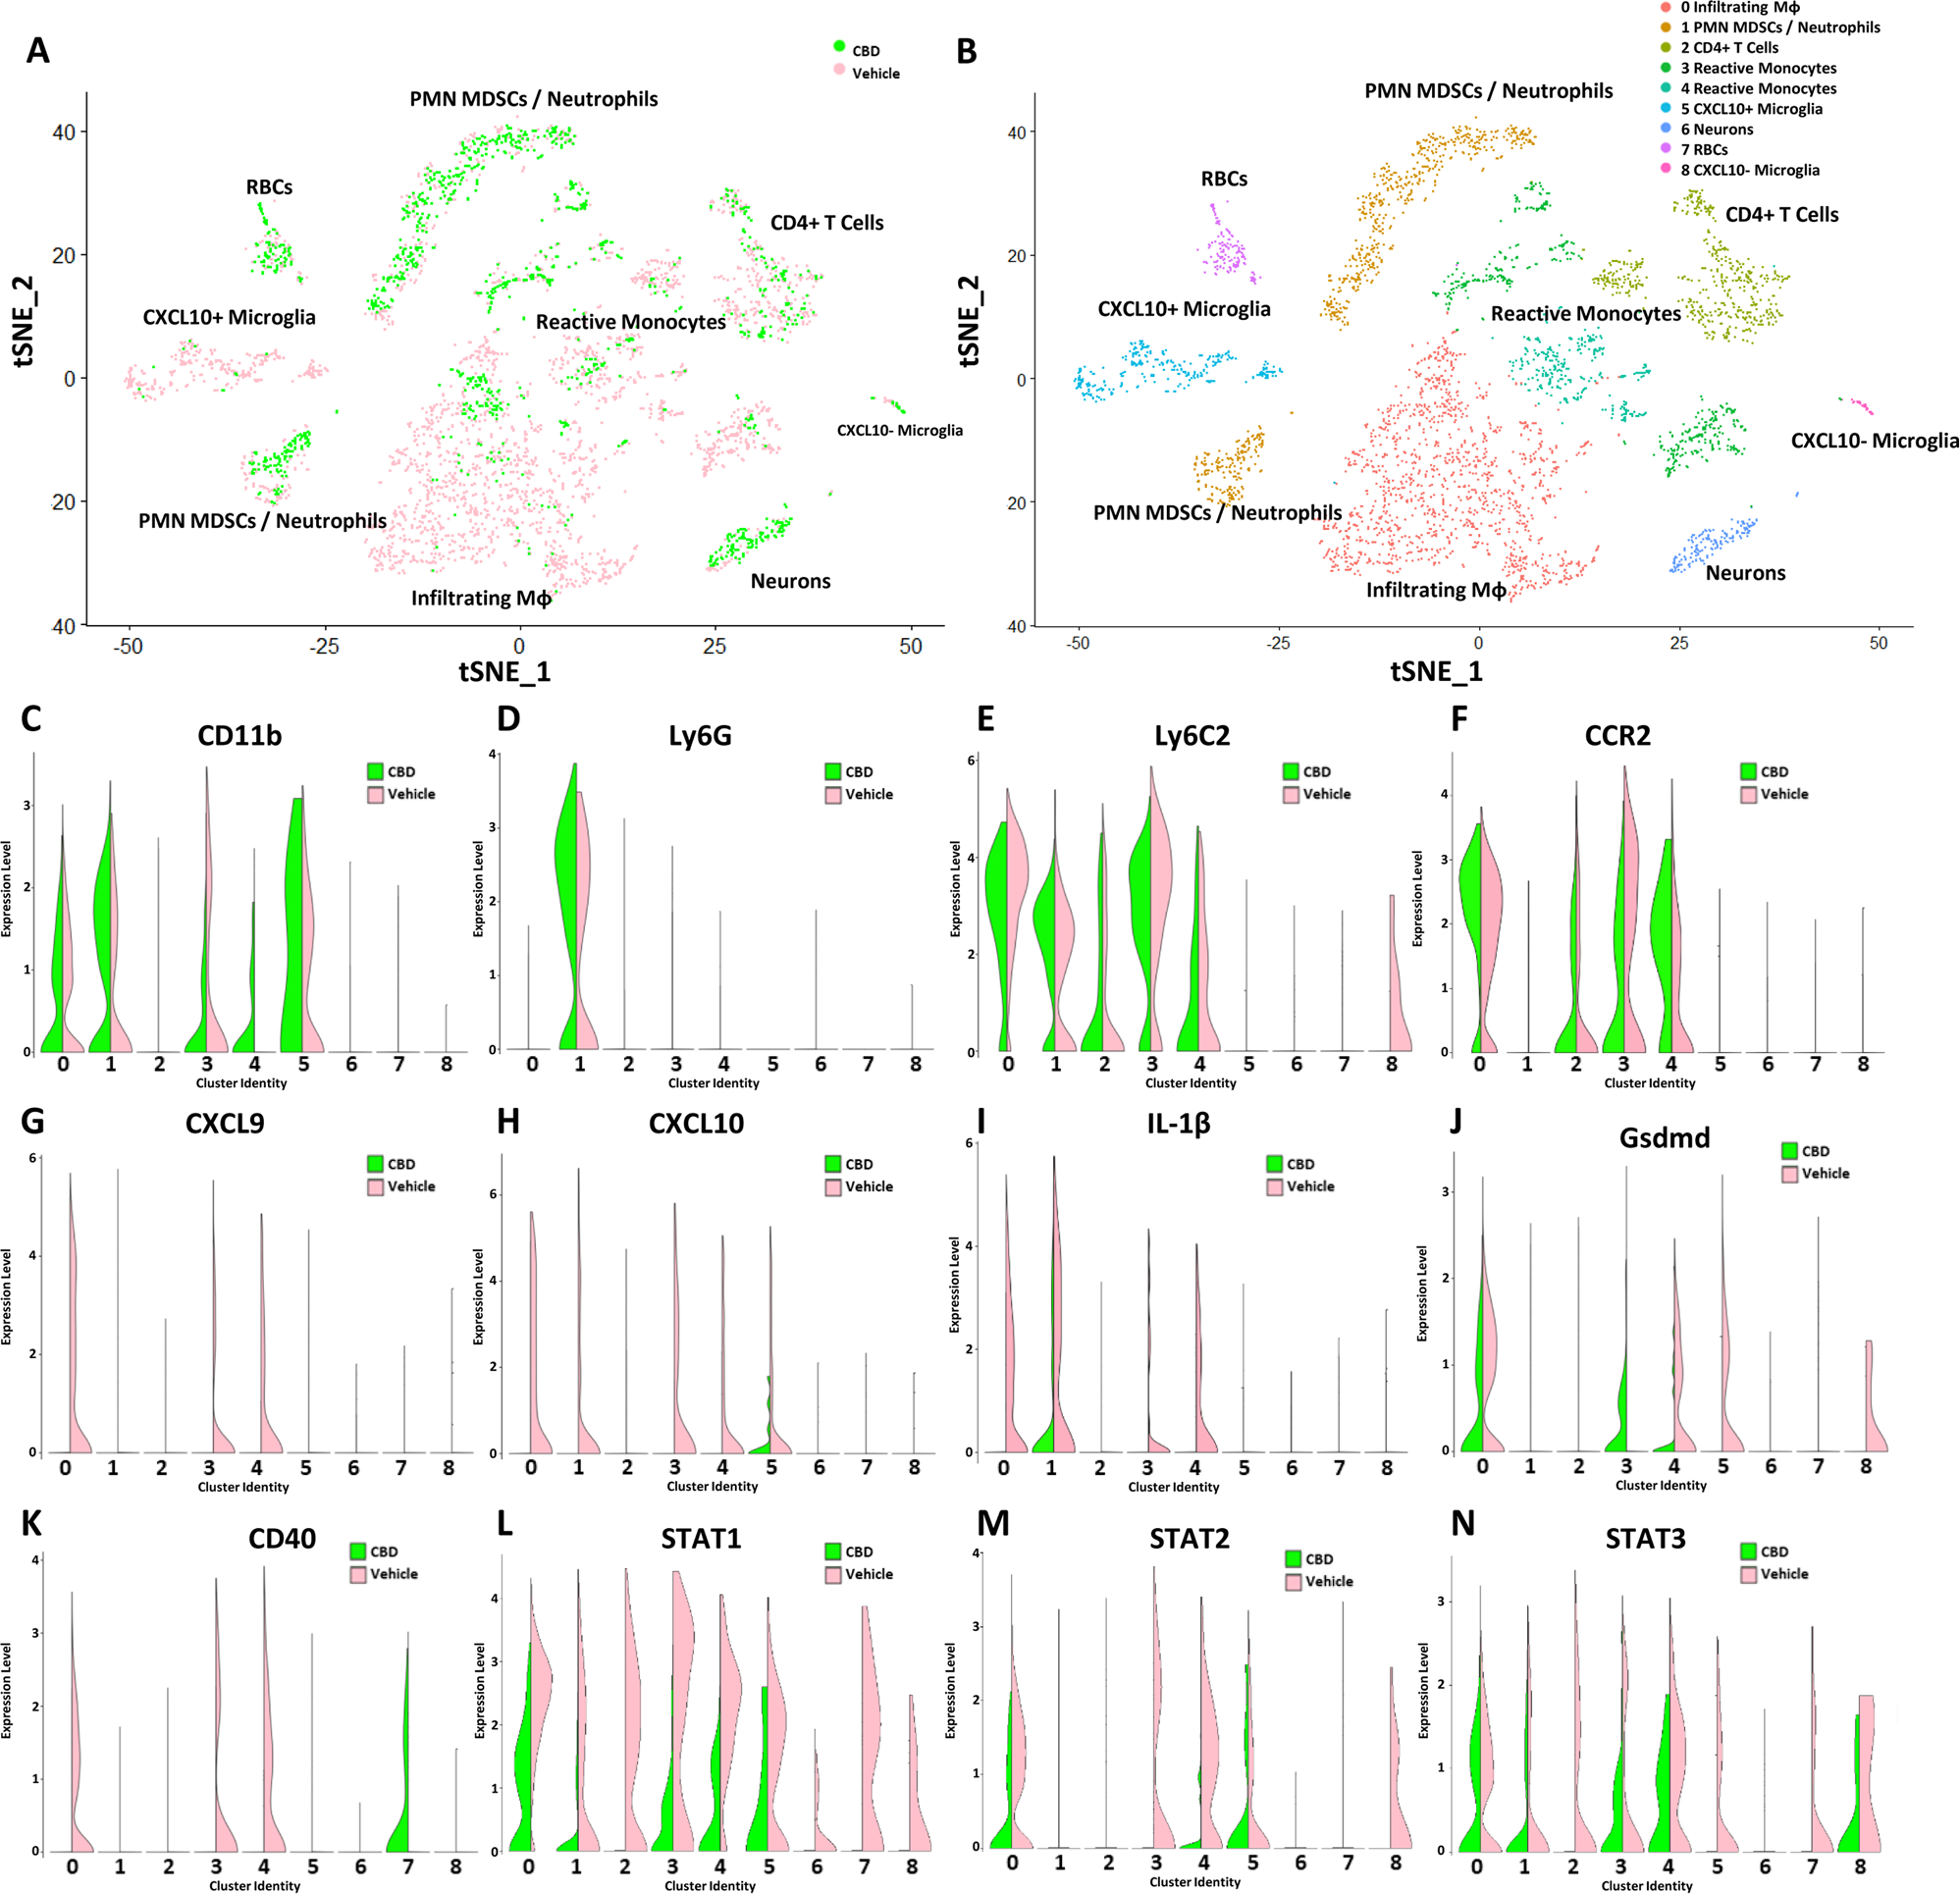
Fig. 2.

CBD Treatment Results in an Anti-Inflammatory Shift in the Transcriptional Profile of Infiltrating Macrophages and Resident Microglia within the CNS. (A) tSNE mapping of scRNA-seq reads from single cell suspensions of whole CNS tissue from vehicle (pink) and CBD (green) treated mice. Vehicle (3,011 Cells – 88,022,395 Reads – 29,233 Mean Reads per Cell) Treatment (1492 Cells – 103,253,015 Reads – 69,204 Mean Reads per Cell). (B) Clusters identified by Seurat based on a resolution of 0.15. Violin plots demonstrating relative expression levels of CD11b (C), Ly6G (D), Ly6C (E), CCR2 (F), CXCL9 (G), CXCL10 (H), IL-1β (I), GSDMD (J), CD40 (K), STAT1 (L), STAT2 (M), and STAT3 (N) amongst clusters identified by Seurat analysis of scRNA sequencing
