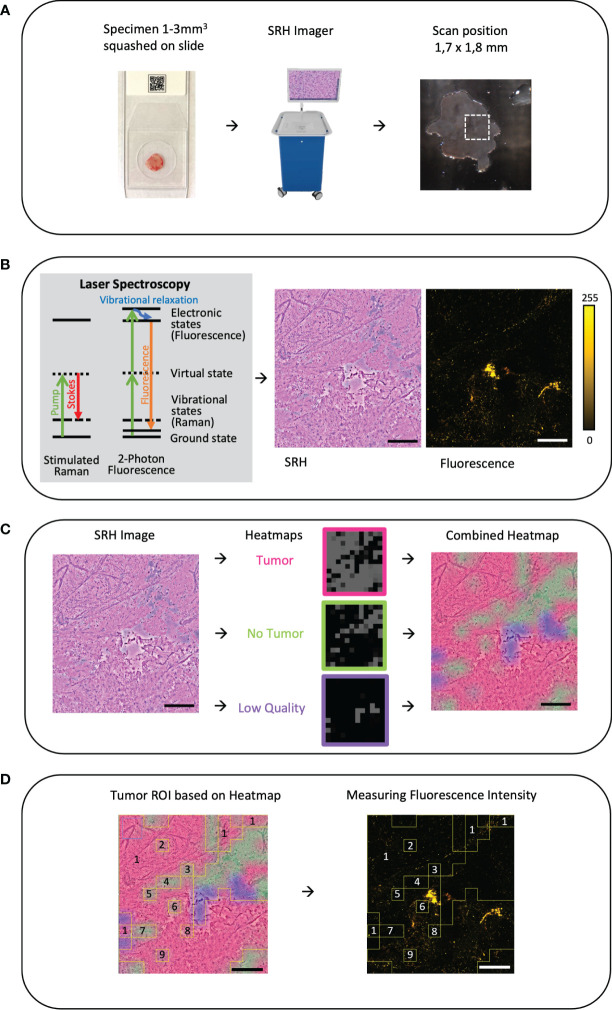
Figure 1.
(A) Workflow and sample preparation. Small tumor sample is squashed onto a slide under a coverslip and then it is placed in the fiber-laser based SRS microscope (Invenio Imaging Inc, Santa Clara, CA, USA). On a picture of the sample on the slide the field of view (FOV 1.7 × 1.8mm) and position can be chosen. Here, on average, three different areas were randomly picked. (B) By combing two different optical events: [1] Raman scattering that leads to vibrational state changes and wavelength shifts and [2] excitation by absorption of light leading to fluorescence emission, virtual hematoxylin-and-eosin-stained-like images with corresponding fluorescence images are generated. (C) Based on an established convolutional neuronal network (CNN) differentiation of tumor (red), non-tumor (green), and low-quality (blue) SRH image is performed and the heatmap is created as an overlay on the SRH image (18). (D) Using the CNN heatmap region of interests (ROIs) were created and overlayed onto the corresponding autofluorescence image to determine the mean fluorescence intensity in the corresponding ROI. In this example, the ROIs 2–9 are subtracted from the ROI 1 to measure the mean tumor intensity. Large image scale bars = 450 µm; count scale: 0–255 counts.

