. 2022 Oct 10;29(5):305–318. doi: 10.32604/or.2022.025187

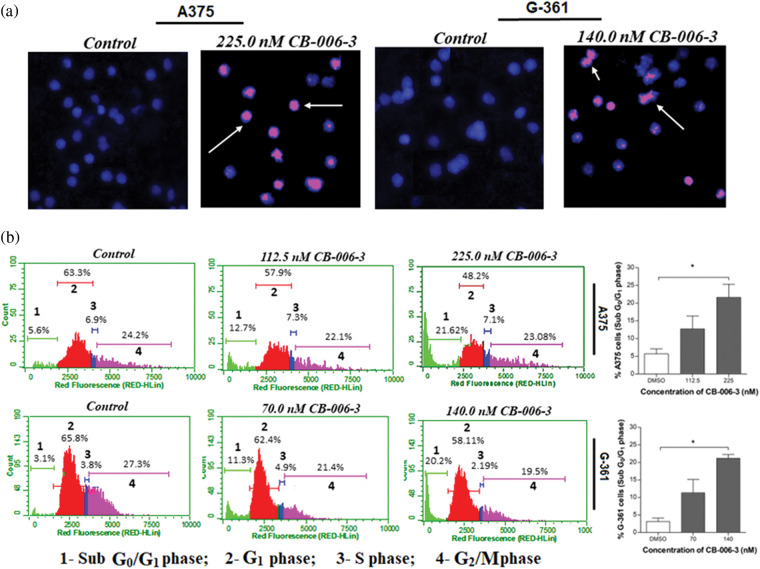
Figure 8. (a) Propidium iodide/Hoechst 333258 dual staining of A375 and G-361 cells after respective near GI50 dose CB-006-3 treatments. Arrows pointing the pink color spots indicate condensed/fragmented nuclei bound with fluorescent stain. Microscopic magnification at 200X. (b) Flow cytometry analysis of A375 and G-361 cell cycles with CB-006-3 treatment after 72 h that depicts percentage cell populations different cell cycle phases. The data were analyzed using ExpressPro Software from Millipore, (Burlington, CA, USA) and representative figures are presented. Histogram bars represents mean ± SD percentage of sub G0/G1 phase cells from three different experiments. Results statistically significant at p ≤ 0.05 (n = 3) compared to * control.

Figure 8