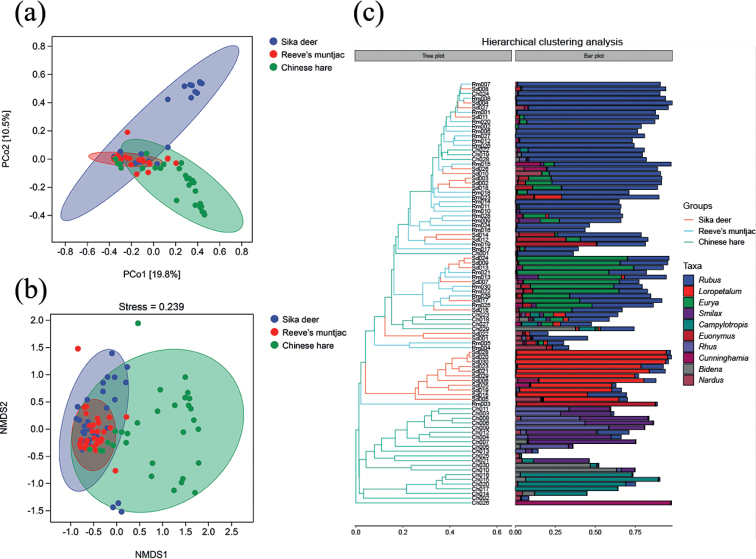
Figure 5.
aPCoA analysis chart, in which each point represents a sample bNMDS analysis chart. Diagram analysis with 95% confidence ellipse c hierarchical clustering diagram. Analysis of the hierarchical clustering tree diagram and the stacked bar diagram of the top 10 genera in abundance (Ch: Chinese hare; Sd: Sika deer; Rm: Reeve’s muntjac).

