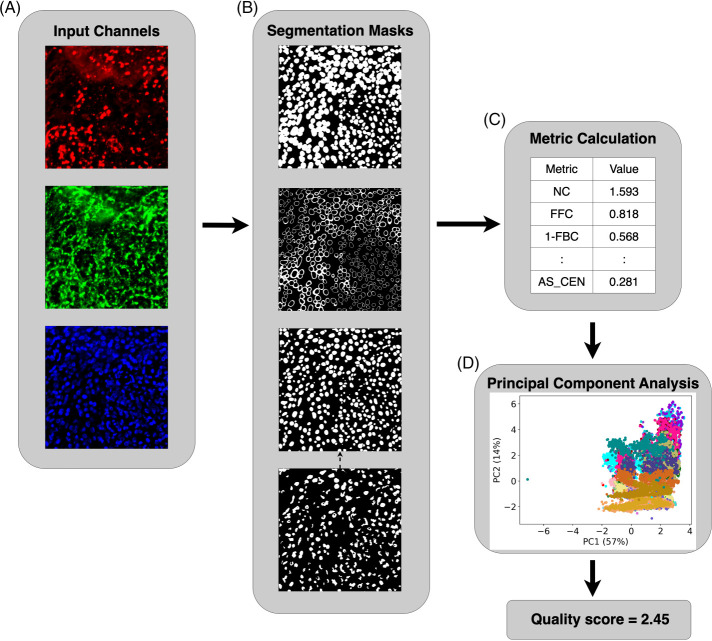
FIGURE 1:
Our pipeline for cell segmentation evaluation. (A) Input channels for cell membrane (red), cytoplasm (green), and nucleus (blue) are available for each segmentation method, but methods only used one or two channels. (B) Methods generate segmentation masks: cell mask, cell outside nucleus mask, and nuclear mask (shown in the top three panels, respectively). For segmentation methods that do not output the nuclear mask, we used an Otsu-thresholded nuclear mask (bottom panel) as a substitute. We removed the pixels in the nuclear mask that were outside the cell membrane in the cell mask, as well as the cells and nuclei that did not have the corresponding nuclei and cells. (C) For each set of segmentation masks, we calculated 14 metrics to evaluate the quality of segmentation objectively under various assumptions. We then applied principal component analysis to the matrix of all metrics for all methods and all images. (D) The scatterplot shows a point for each segmentation for each image. Different colors represent different segmentation methods. Finally, a variance-weighted sum of PC1 and PC2 was used to generate an overall quality score for each combination of method and image.

