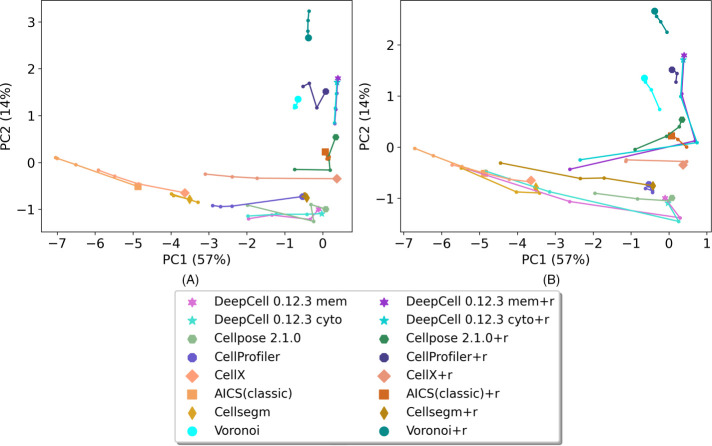
FIGURE 3:
Top two principal components of each method on images from all modalities. (A) Results from images with Gaussian noise perturbation. (B) Result from images with downsampling. Each method is represented by a unique color. The points with a unique marker shape represent unperturbed images. The trajectories represent low, medium, and high Gaussian noise perturbation, A, or small, medium, and large degree of downsampling, B. Only the results from the latest DeepCell and Cellpose are shown, for better visualization. Supplemental Figure 3 shows results from the earlier versions.

