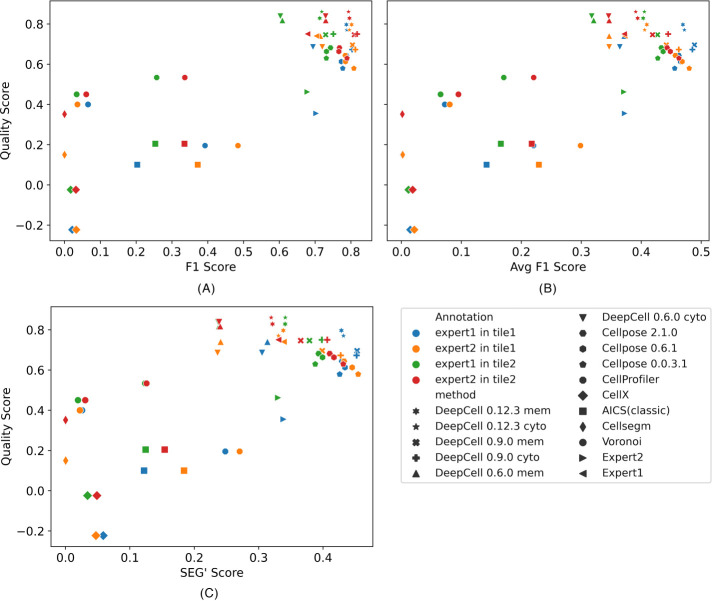
FIGURE 6:
Comparing quality score with three benchmarks: F1 score (A), Avg F1 score (B) and SEG’ score (C). Each marker represents a segmentation or an expert annotation. Each color represents the benchmark that was calculated with the marker’s segmentation/annotation against an expert annotation in a CODEX image (tile). Pearson correlations between our quality score and three benchmarks are 0.83, 0.81, and 0.72, respectively.

