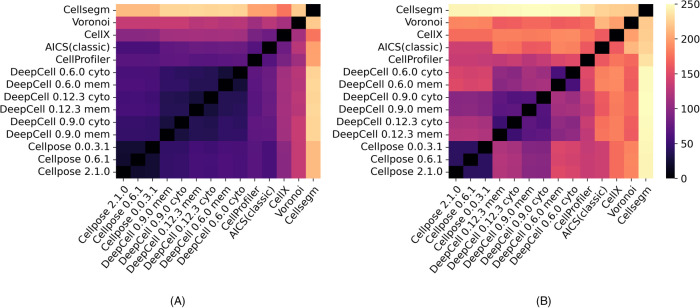
FIGURE 8:
Heat maps of difference scores between segmentation methods. A score of zero represents no difference (i.e., identical segmentations). Larger (lighter) values indicate greater differences between methods. (A) Heat map generated by the difference between metrics of two single methods. (B) Heat map generated by the pairwise metrics that directly compare two methods’ segmentations. The methods are ordered by clustering.

