FIGURE 4:
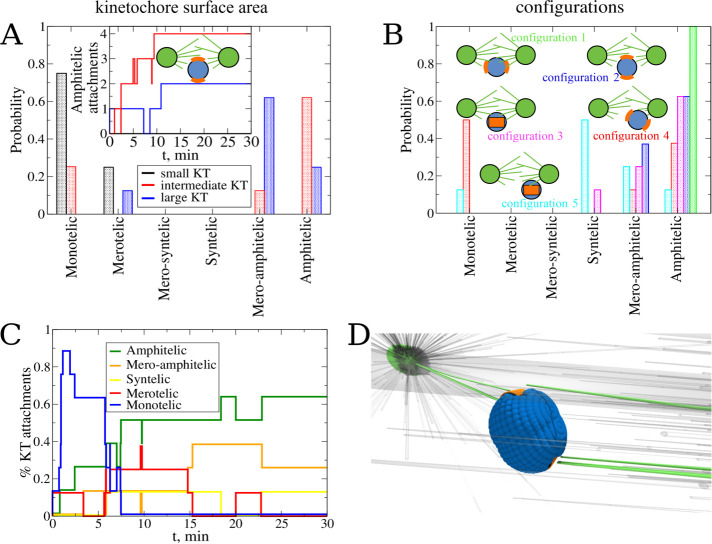
Exploring the effect of the kinetochore size and initial configuration of the chromosome. Panels A and B show the effect of the KT surface area on the attachment accuracy. (A) Probability to find each type of attachment for the system with large (blue), intermediate (red), and small (black) KT surface area. Statistics of attachments were collected from eight independent CellDynaMo simulations for all three case studies. The number of amphitelic attachments as a function of time collected from all eight simulation runs for all three case studies are shown in the inset. (B) Probability to find each type of attachment for the system with a single KT pair without CH arms. Different colors represent different initial positions and orientations (see Figure 2, A–E): configuration 1 is green, 2 is blue, 3 is magenta, 4 is red, and 5 is cyan. Statistics were collected from eight independent simulations for all initial configurations 1–5. (C) The normalized number of attachments of different types as a function of time collected from all eight simulation runs for initial configuration 3. (D) Snapshot of a final position and orientation for the largest KT surface (merotelic attachment).

