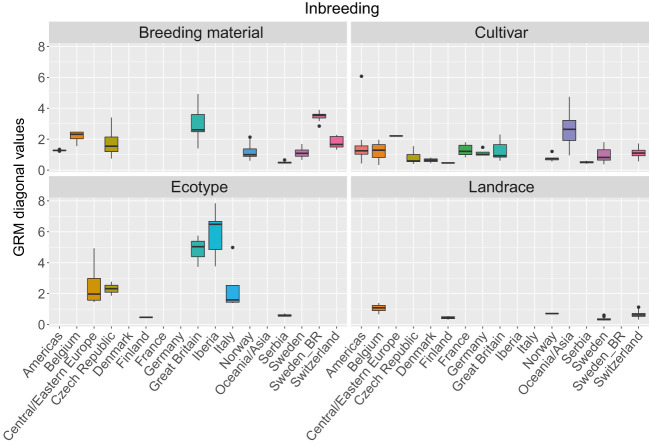
Figure 3.
Variation in inbreeding expressed as the as values of the diagonal of the genomic relationship matrix (GRM) among 392 red clover accessions from different countries or regions. The GRM was calculated based on SNPs allele frequencies. Values above 1 indicate inbreeding, while values below 1 indicate outbreeding. F2 breeding populations from Sweden (Sweden_BR) were kept as a separate group. See Table 1 for number of accessions belonging to each geographical group.

