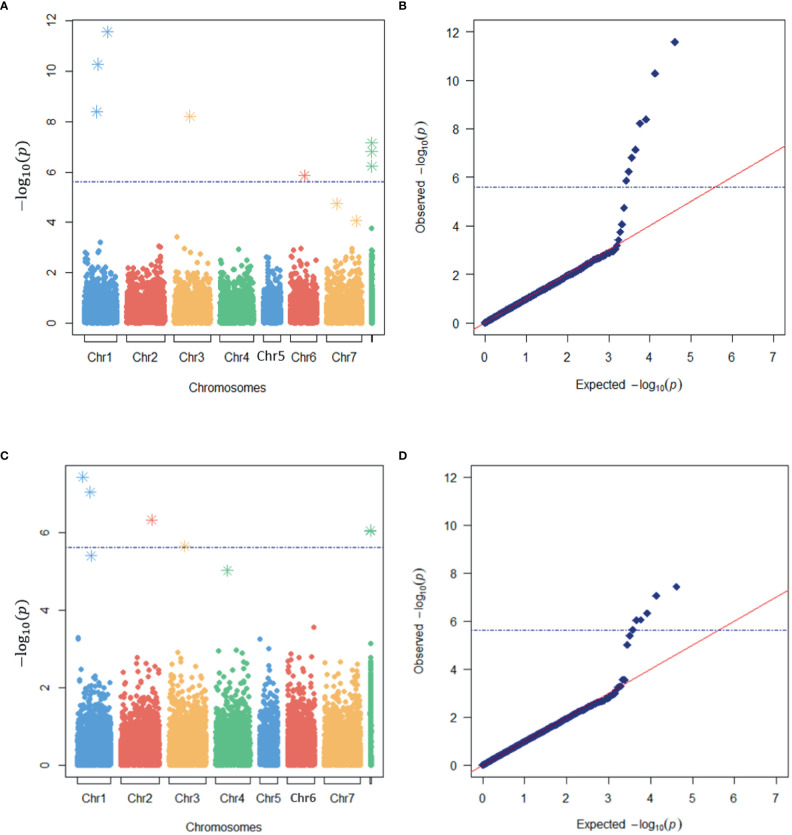
Figure 4.
Identification of markers associated with freezing tolerance in a genome-wide association study (GWAS) of red clover. Manhattan (A, C) and quantile-quantile (QQ) (B, D) plots of the expected and observed -log10(p) –values of markers in the SNP-based (A, B) and haplotype-based (C, D) GWAS models with the lowest e-BIC values. The blue broken horizontal lines represent the Bonferroni threshold while asterisks represent the SNPs or haplotypes used as cofactors in the MLMM analyses.

