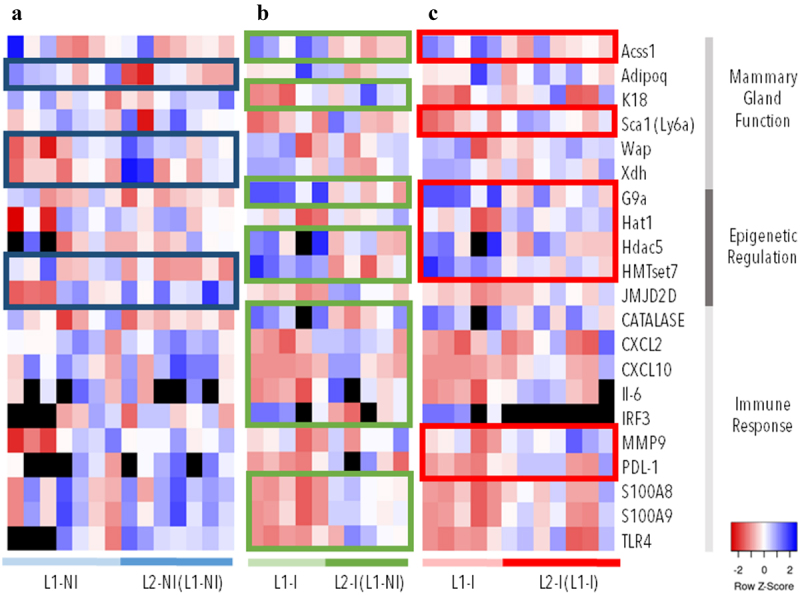
Figure 3.

Gene expression (∆∆Ct) in three comparisons: 1st (n = 7) vs. 2nd lactations in physiological conditions (n = 7) (blue), 1st (n = 5) vs. 2nd lactations with inflammation (n = 5) (green), and 1st (n = 5) vs. 2nd lactations with inflammation and previous inflammation history (n = 7) (red). The expression of 60 genes was analysed. The genes listed in this figure are differentially expressed (p < 0.05) in at least one comparison (colour-coded rectangles). Each column represents one individual. Lowest gene expression is represented in blue (highest ∆∆Ct values), highest – in red (lowest ∆∆Ct values), no data available – in black.
