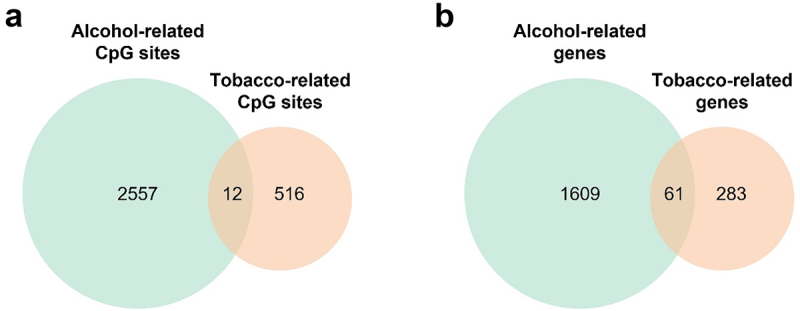
Figure 3.

Venn diagrams comparing CpG sites and genes differentially methylated for tobacco and alcohol use. (a) Comparison between differentially methylated CpG sites with a P-value adjusted lower than 0.05. (b) Comparison between genes where the CpG sites differentially methylated are annotated.
