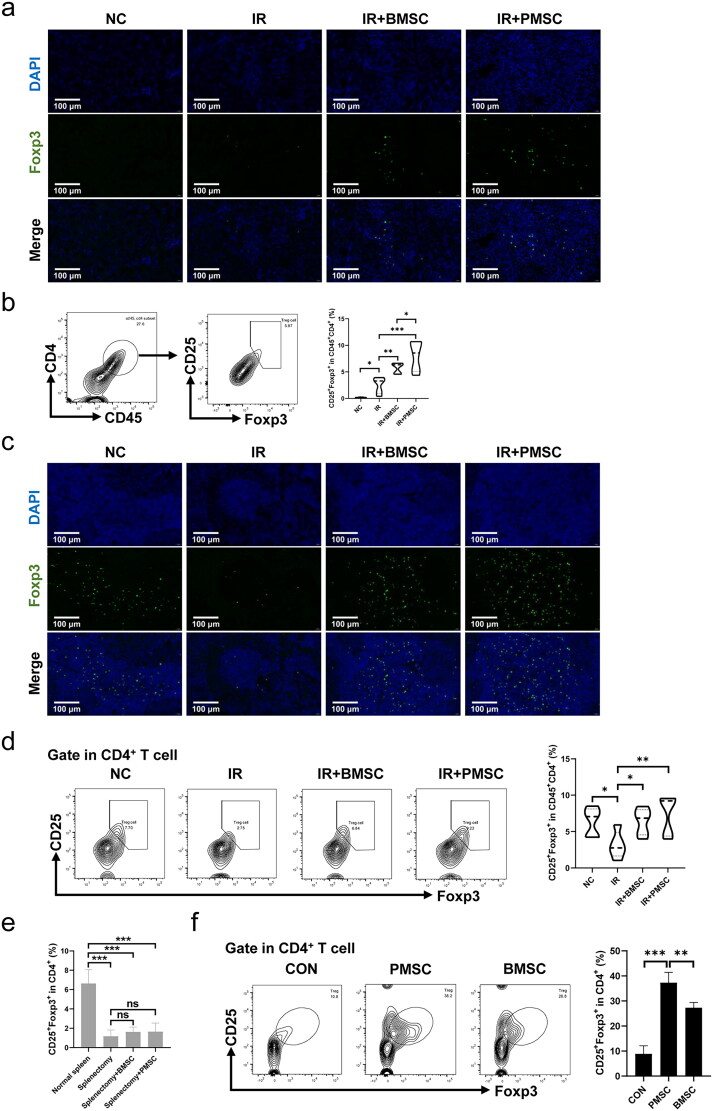
Figure 3.
PMSCs promoted Treg increase and differentiation. (a) Immunofluorescence staining of Foxp3 (green) and DAPI (blue) in the kidney. Scale bars: 100 μm. (b) Helper T cells in the kidney were demonstrated through the expression of CD45 and CD4. Tregs were verified from helper T cells through the expression of CD25 and Foxp3. The statistical analysis of Treg proportions in helper T cells from the kidney single-cell suspension in the NC (n = 5), IR (n = 5), IR + BMSC (n = 5), and IR + PMSC (n = 5) groups. (c) Immunofluorescence staining of Foxp3 (green) and DAPI (blue) in the spleen. Scale bars: 100 μm. (d) Detection of CD45+CD4+CD25+Foxp3+Tregs from the spleen single cell suspension in the NC, IR, IR + BMSC, and IR + PMSC groups by flow cytometry. The statistical analysis of Treg proportions in helper T cells from the spleen in the NC (n = 5), IR (n = 5), IR + BMSC (n = 5), and IR + PMSC (n = 5) groups. (e) The statistical analysis of Treg proportions in CD4+ T cells from the kidney single-cell suspension in the normal spleen (n = 4), splenectomy (n = 4), splenectomy + BMSC (n = 4), and splenectomy + PMSC (n = 4) groups. (f) The statistical analysis of CD4+CD25+Foxp3+ Treg proportions in CD4+ T cells collected after in vitro culture in the CON (n = 3), BMSC (n = 3), and PMSC (n = 3) groups. The Kruskal–Wallis one-way analysis of variance and post hoc tests with all pairwise were used to evaluate the differences. *p < .05; **p < .01; ***p < .001.

