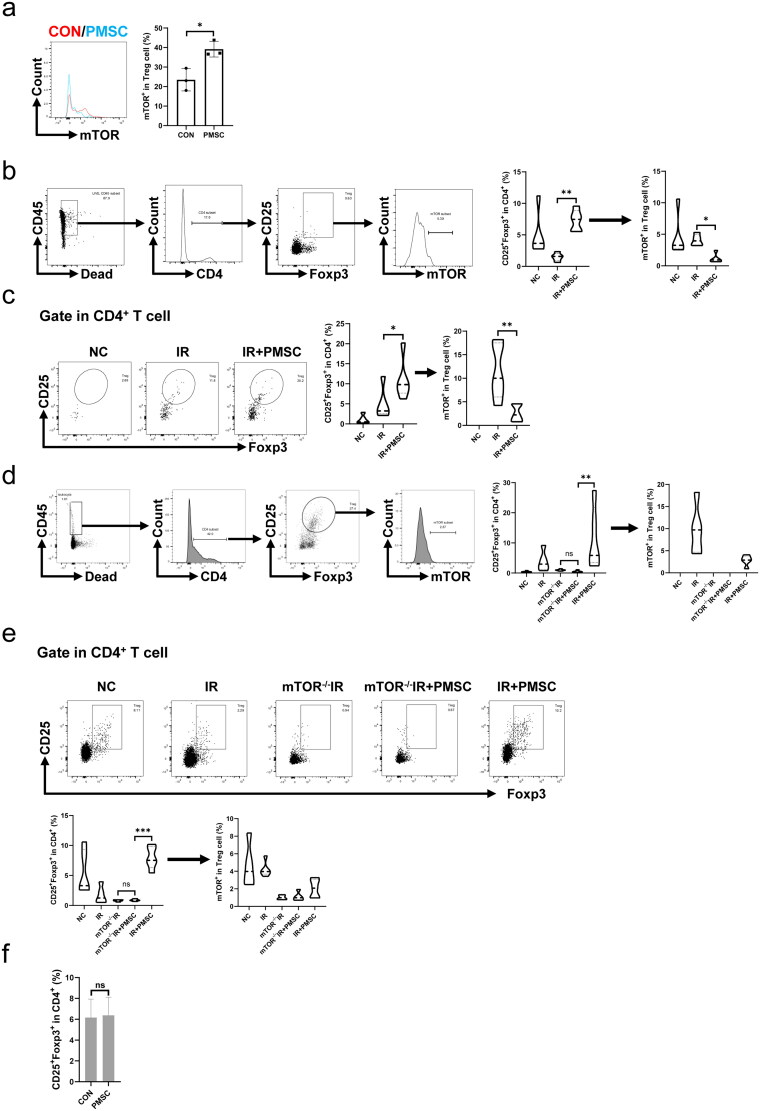
Figure 7.
mTOR exerted as a critical mediator during PMSC promotion for Tregs. (a) The statistical analysis of mTOR phosphorylation levels in CD4+CD25+Foxp3+Treg collected after in vitro culture in the CON (n = 3) and PMSC (n = 3) groups. (b) The gating strategy to determine mTOR phosphorylation in Tregs from spleen single-cell suspension. The statistical analysis of Treg proportions in helper T cells and their mTOR phosphorylation level from Tregs in the NC (n = 5), IR (n = 5), and IR + PMSC (n = 5) groups. (c) Detection of CD4+CD25+Foxp3+Tregs from the kidney single cell suspension in the NC, IR, and IR + PMSC groups by flow cytometry. The statistical analysis of Treg proportions in helper T cells and their mTOR phosphorylation level from Tregs in the NC (n = 5), IR (n = 5), and IR + PMSC (n = 5) groups. (d) The gating strategy to determine mTOR phosphorylation in Tregs from kidney single cell suspension. The statistical analysis of Treg proportions in helper T cells and their mTOR phosphorylation level from Tregs in the NC (n = 5), IR (n = 5), mTOR–/–IR (n = 5), mTOR–/–IR + PMSC (n = 5), and IR + PMSC (n = 5) groups. (e) Detection of CD4+CD25+Foxp3+Tregs from the spleen single cell suspension in the NC, IR, mTOR–/–IR, mTOR–/–IR + PMSC, and IR + PMSC groups by flow cytometry. The statistical analysis of Treg proportions in helper T cells and their mTOR phosphorylation level from Tregs in the NC (n = 5), IR (n = 5), mTOR–/–IR (n = 5), mTOR–/–IR + PMSC (n = 5), and IR + PMSC (n = 5) groups. (f) The statistical analysis of Treg proportions in helper T cells collected after in vitro culture in the CON (n = 4) and PMSC (n = 4) groups. The differences for between-group comparisons were analyzed by an independent-sample t-test. The differences for among-group comparisons were analyzed by the Kruskal–Wallis one-way analysis of variance and post hoc tests with all pairwise. ns, p > .05; *p < .05; **p < .01; ***p < .001.

