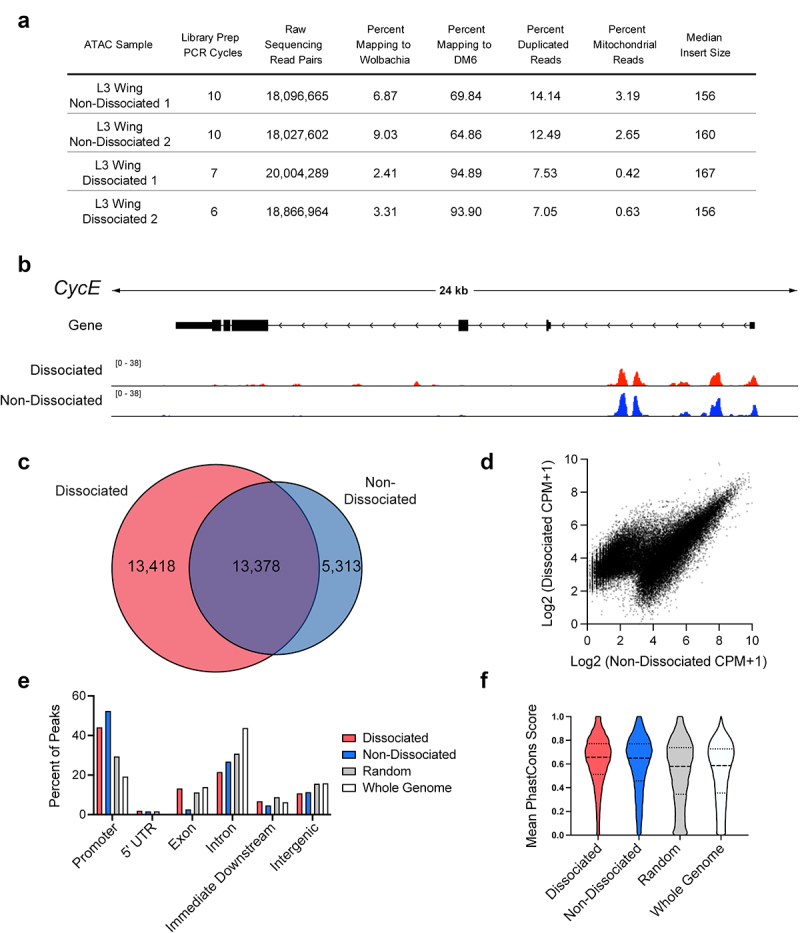
Figure 3.

Wing disc dissociation is compatible with generation of high-quality ATAC-Seq libraries. (a) Table of quality metrics comparing ATAC-Seq libraries prepared from non-dissociated versus dissociated third larval instar (L3) wing discs. (b) ATAC-Seq reads at the cycE gene locus from dissociated (red) and non-dissociated (blue) L3 wing discs. Arrows on gene diagram indicate the direction of transcription. Y-axes for ATAC-Seq tracks: normalized read counts per million. (c) Venn diagram depicting the overlap between ATAC-Seq peaks called from dissociated (red) and non-dissociated (blue) L3 wing discs. (d) Scatter plot depicting the average signal intensity (log2-transformed counts per million) in dissociated (y-axis) and non-dissociated (x-axis) L3 wing discs for the union set of peak regions called in each condition. (e and f) Percent of peaks residing at various genomic elements (e) and distribution of mean PhastCons scores (F) from dissociated (red) or non-dissociated (blue) L3 wing disc ATAC-Seq libraries, as well as from randomized peak regions (gray) and 250 bp regions covering the entire genome (white). Additional data including Pearson correlation coefficients for dissociated vs. non-dissociated wings are provided in Supplemental Fig. 2.
