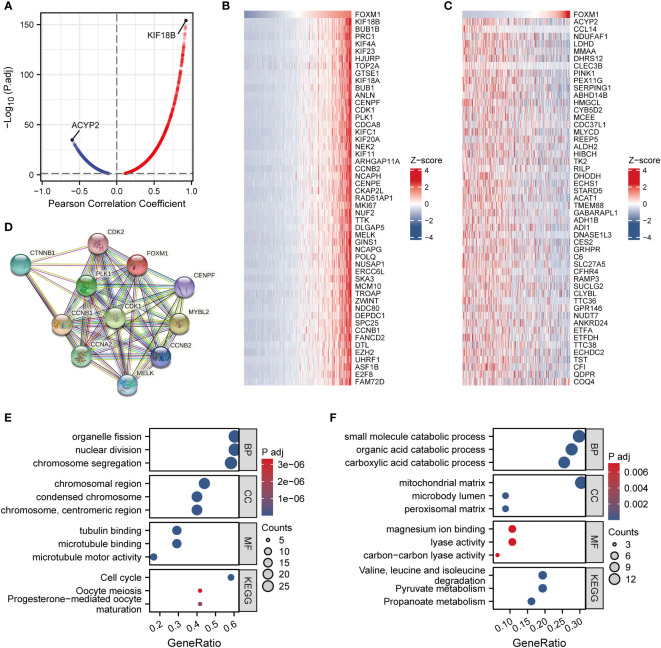
Figure 3.
Co-expression network analysis and enrichment analysis of FOXM1 in LIHC. (A) Volcano map of correlative genes of FOXM1. (B) Heat map of Top50 positive co-expression genes with FOXM1. (C) Heat map of top50 negative co-expression genes with FOXM1. (D) PPI network analysis of FOXM1. Gene ontology and KEGG analysis for genes belonging to the co-expression with strongest positive (E) and negative correlation (F) with FOXM1.

