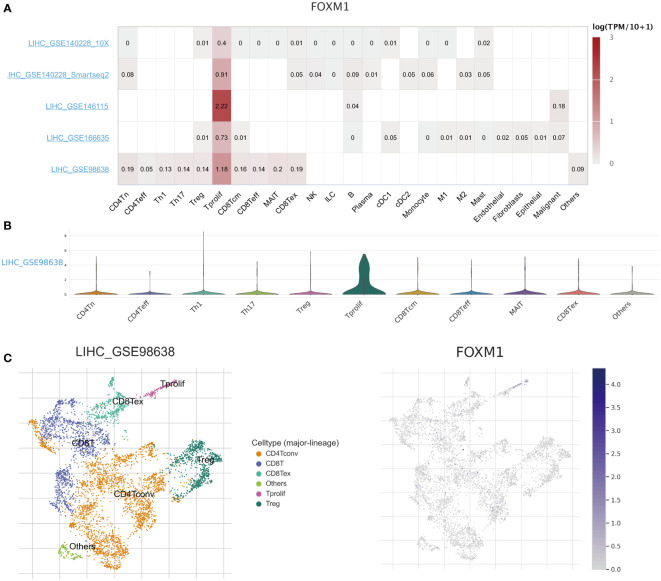
Figure 5.
The scRNA-seq analysis of the expression of FOXM1 in different immune cells of HCC. (A) Heatmap of the correlation of FOXM1 with immune cell infiltration levels in the independent scRNA-seq database. (B) Violin plot of FOXM1 and immune cell infiltration. (C) Single-cell atlas of all cells in GSE98638 dataset and the expression and distribution of FOXM1.

