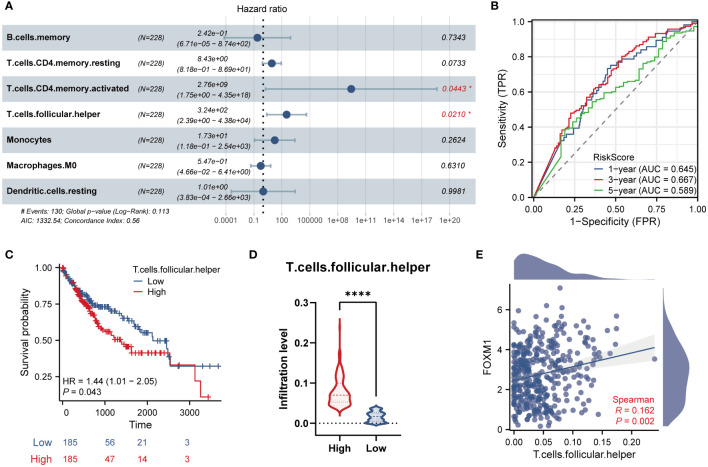
Figure 7.
Validation and survival analysis of the key infiltrated immune cells. (A) Multivariate Cox Forest plots related to the prognosis of 7 key immune cells. (B) The AUC values of the time ROC curves. (C) The Kaplan-Meier curve of Tfh cells infiltration level and overall survival. (D) The violin plot of Tfh cells infiltration in FOXM1 high and low expression groups. (E) The scatter plot of the correlation between the infiltration level of Tfh cells and the FOXM1 expression. (*p < 0.05, ****p < 0.0001).

