Figure 9.
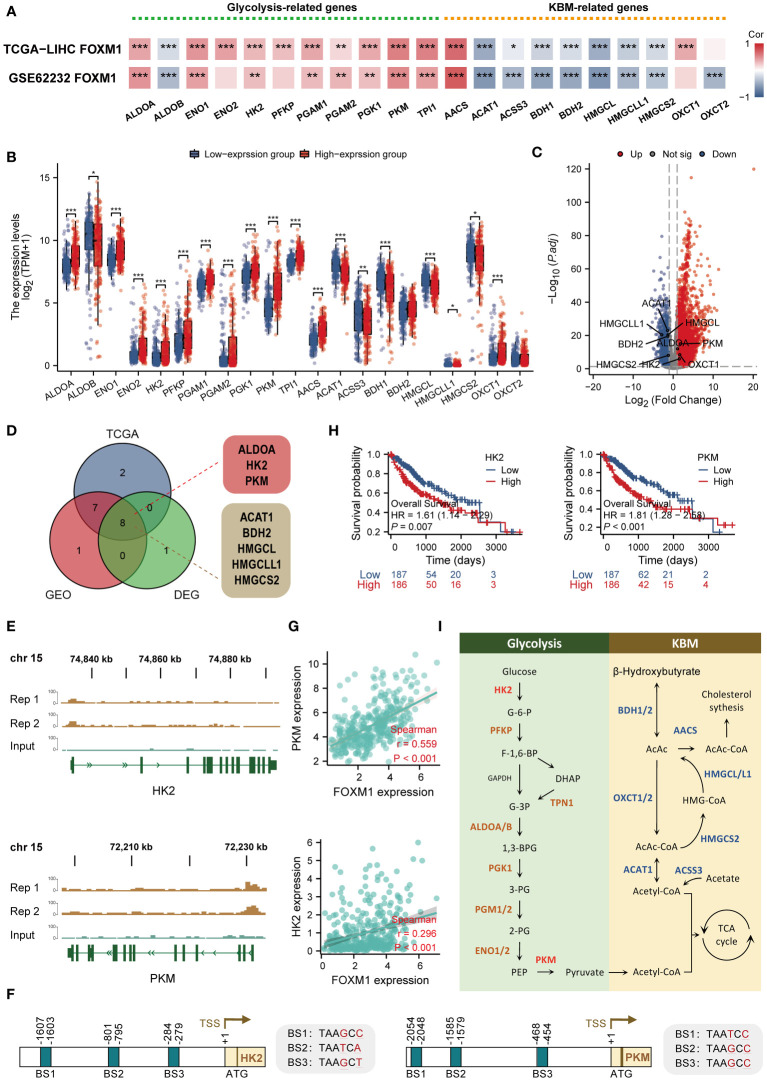
FOXM1 is highly correlated with glycolysis/KBM-related genes and has the ability to potentially transcribe HK2 and PKM. (A) Heat map of the correlation between FOXM1 and glycolysis/KBM-related gene expression. (B) Differences in glycolysis/KBM-related genes between FOXM1 high and low expression groups. (C) Volcano plots of mRNA that were differentially expressed between HCC and normal tissues. (D)Venn diagram of glycolysis/KBM-related genes positively associated with FOXM1 and DEGs in HCC. (E) Genome browser screenshots of the FOXM1 binding sites. The test group has two replicates, and the peaks shown are statistically significant. (F) Schematic model illustrating the glycolysis and KBM pathway. (G) The scatter plot shows the correlation between the overlapping genes and FOXM1. (H) Kaplan-Meier overall survival curves of HK2 and PKM. (I) Diagram showing the position of the recognized promoter sites in FOXM1. The selected signature genes are marked in the pathway, with glycolytic enzymes in brown, ketone bodies metabolic genes in blue, and the FOXM1-bindin genes highlighted in red. (*p < 0.05, **p < 0.01, ***p < 0.001).

