
FIGURE 1.
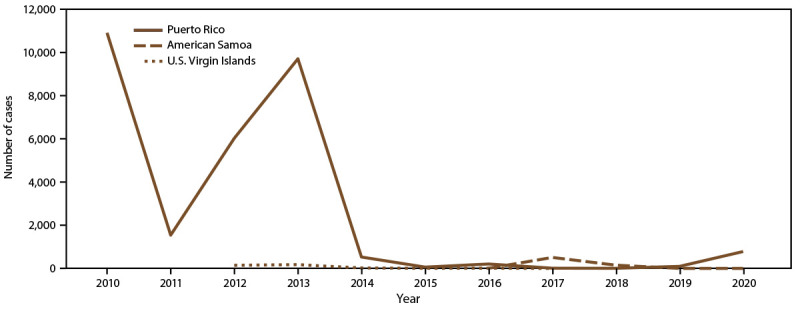
Number of dengue cases, by U.S. territory and year of onset, 2010–2020*
* Puerto Rico: N = 29,862; American Somoa: N = 660; U.S. Virgin Islands: N = 353.
Source: ArboNet.
Official websites use .gov
A
.gov website belongs to an official
government organization in the United States.
Secure .gov websites use HTTPS
A lock (
) or https:// means you've safely
connected to the .gov website. Share sensitive
information only on official, secure websites.
Number of dengue cases, by U.S. territory and year of onset, 2010–2020*
* Puerto Rico: N = 29,862; American Somoa: N = 660; U.S. Virgin Islands: N = 353.
Source: ArboNet.