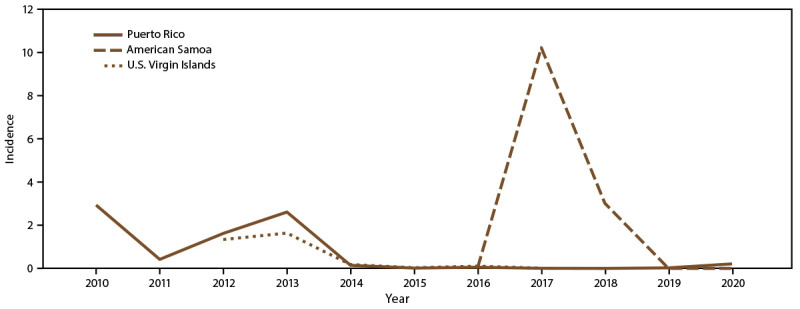
FIGURE 2.

Annual incidence* of dengue cases, by U.S. territory and year of onset, 2010–2020†
* Per 1,000 population using 2020 U.S. census population data.
† Puerto Rico: N = 29,862; American Somoa: N = 660; U.S. Virgin Islands: N = 353.
Source: ArboNet.
