
FIGURE 6.
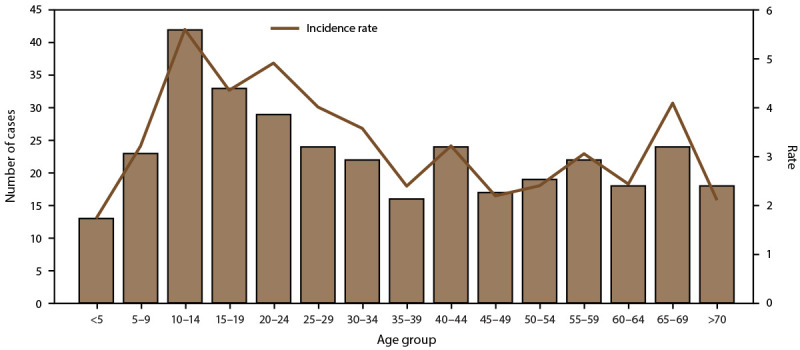
Number of dengue cases and incidence rate* — U.S. Virgin Islands, 2010–2020†
* Per 1,000 population using 2020 U.S. census population data.
† N = 353.
Source: ArboNet.
Official websites use .gov
A
.gov website belongs to an official
government organization in the United States.
Secure .gov websites use HTTPS
A lock (
) or https:// means you've safely
connected to the .gov website. Share sensitive
information only on official, secure websites.
Number of dengue cases and incidence rate* — U.S. Virgin Islands, 2010–2020†
* Per 1,000 population using 2020 U.S. census population data.
† N = 353.
Source: ArboNet.