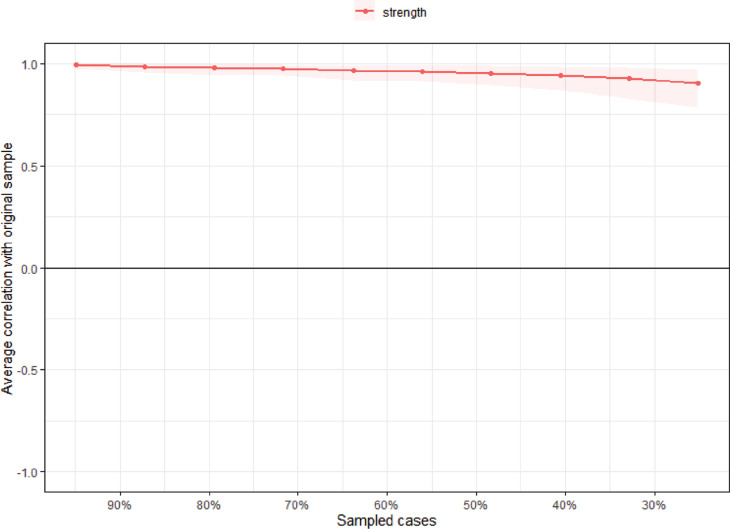
Figure S6.
Average correlations between strengths of networks estimated for time 2 with sampled participants and original sample. Lines indicate the means and areas indicate the range from the 2.5th to the 97.5th percentile. The CS-coefficient for strength [CS (cor = 0.7) = 0.749] is higher than 0.5 suggesting the centrality indices were stable.

