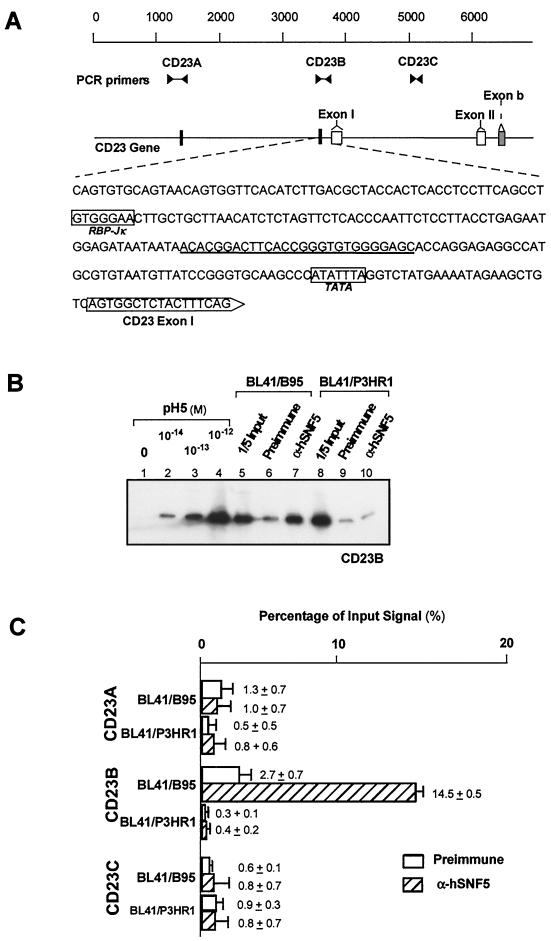
FIG. 5.
Targeting of the hSWI-SNF complex to the CD23 gene. (A) Schematic of the upstream region of the CD23 gene containing exons I, II, and b. The two RBP-Jκ/CBF1 binding sites present in this region are indicated by solid rectangles. The upstream sequence from exon I is shown with the RPB-Jκ/CBF1 and TATA elements. Positions of the PCR primers (sequences shown in Table 1) and their product lengths are also shown. (B) Targeting of the hSWI-SNF complex to three regions on the CD23 gene in BL41/B95 and BL41/P3HR1 cells were measured by immunoprecipitation and quantitative PCR with specific primer sets. The autoradiogram of quantitative PCR using the CD23B primer set is depicted. Lanes 1 to 4, PCR of template controls; lanes 5 and 8, PCR results from the preimmunoprecipitated input (1/5 of total) chromatin; lanes 6, 7, 9, and 10, PCR results from the immunoprecipitated samples. (C) Results of PhosphorImager analysis of PCR performed with CD23A, CD23B, and CD23C primer sets on chromatin immunoprecipitation samples. Results are reported as the percentage of signal obtained from chromatin prior to immunoprecipitation.

