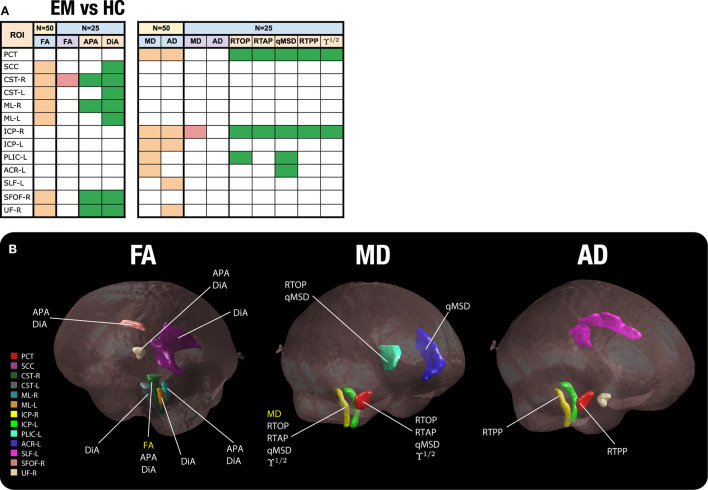
Figure 7.
Significant ROIs found for a reduced sample size (N = 25). (A) Table of ROIs found at N = 25 compared to the original sample size (EM vs. HC). In amber, the ROIS with differences for DTI at the original sample size; in red, those ROIS with differences for DTI for a reduced sample size (N = 25); in green, those ROIS with differences for AMURA for a reduced sample size (N = 25). (B) The 13 ROIs detected by DTI at the original sample size are shown in the white matter. For each ROI, we have added the label of those metrics that show significant differences for a sample size of N = 25.

