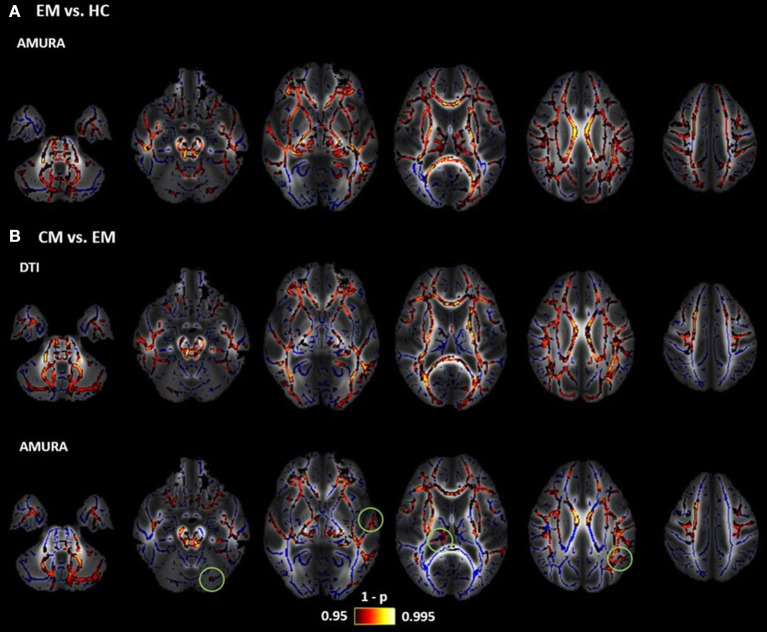
Figure 8.
Results of TBSS analysis: statistically significant clusters of voxels distinguishing between DTI and AMURA approaches. Mean FA image at the background, FA skeleton colored in blue and significant ROIs colored in red-yellow. (A) Episodic Migraine (EM) vs. Healthy Controls (HC): merged AMURA measures (RTOP, RTAP, APA, qMSD, ϒ1/2, and DiA). (B) CM vs. EM: merged DTI (AD and MD) and AMURA (RTPP and ϒ1/2) measures. DTI measures do not detect any significant ROI either in EM vs. HC nor CM vs. HC. Green circles showed the areas where AMURA measures showed differences in group comparisons where the DTI ones did not.

