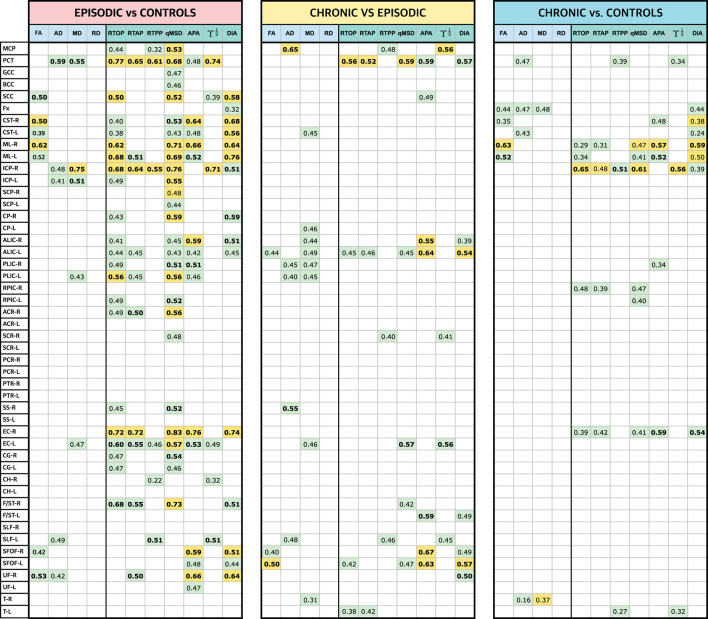
Table 2.
Results of the ROI-based statistical analysis and Cohen's D: EM vs. HC, CM vs. EM, and CM vs. HC.
Two-sample t-tests for DTI and AMURA measures and each of the ROIs defined by thee JHU WM atlas. The p-values represent the probability that a certain measure has identical means for both groups. ROIs exhibiting differences with statistical significance above 95% (p < 0.05) are marked in green and above 99% (p < 0.01) in amber. The Cohen's D of those ROIs showing statistical differences is included.

