. 2023 May 24;131(5):057009. doi: 10.1289/EHP11363

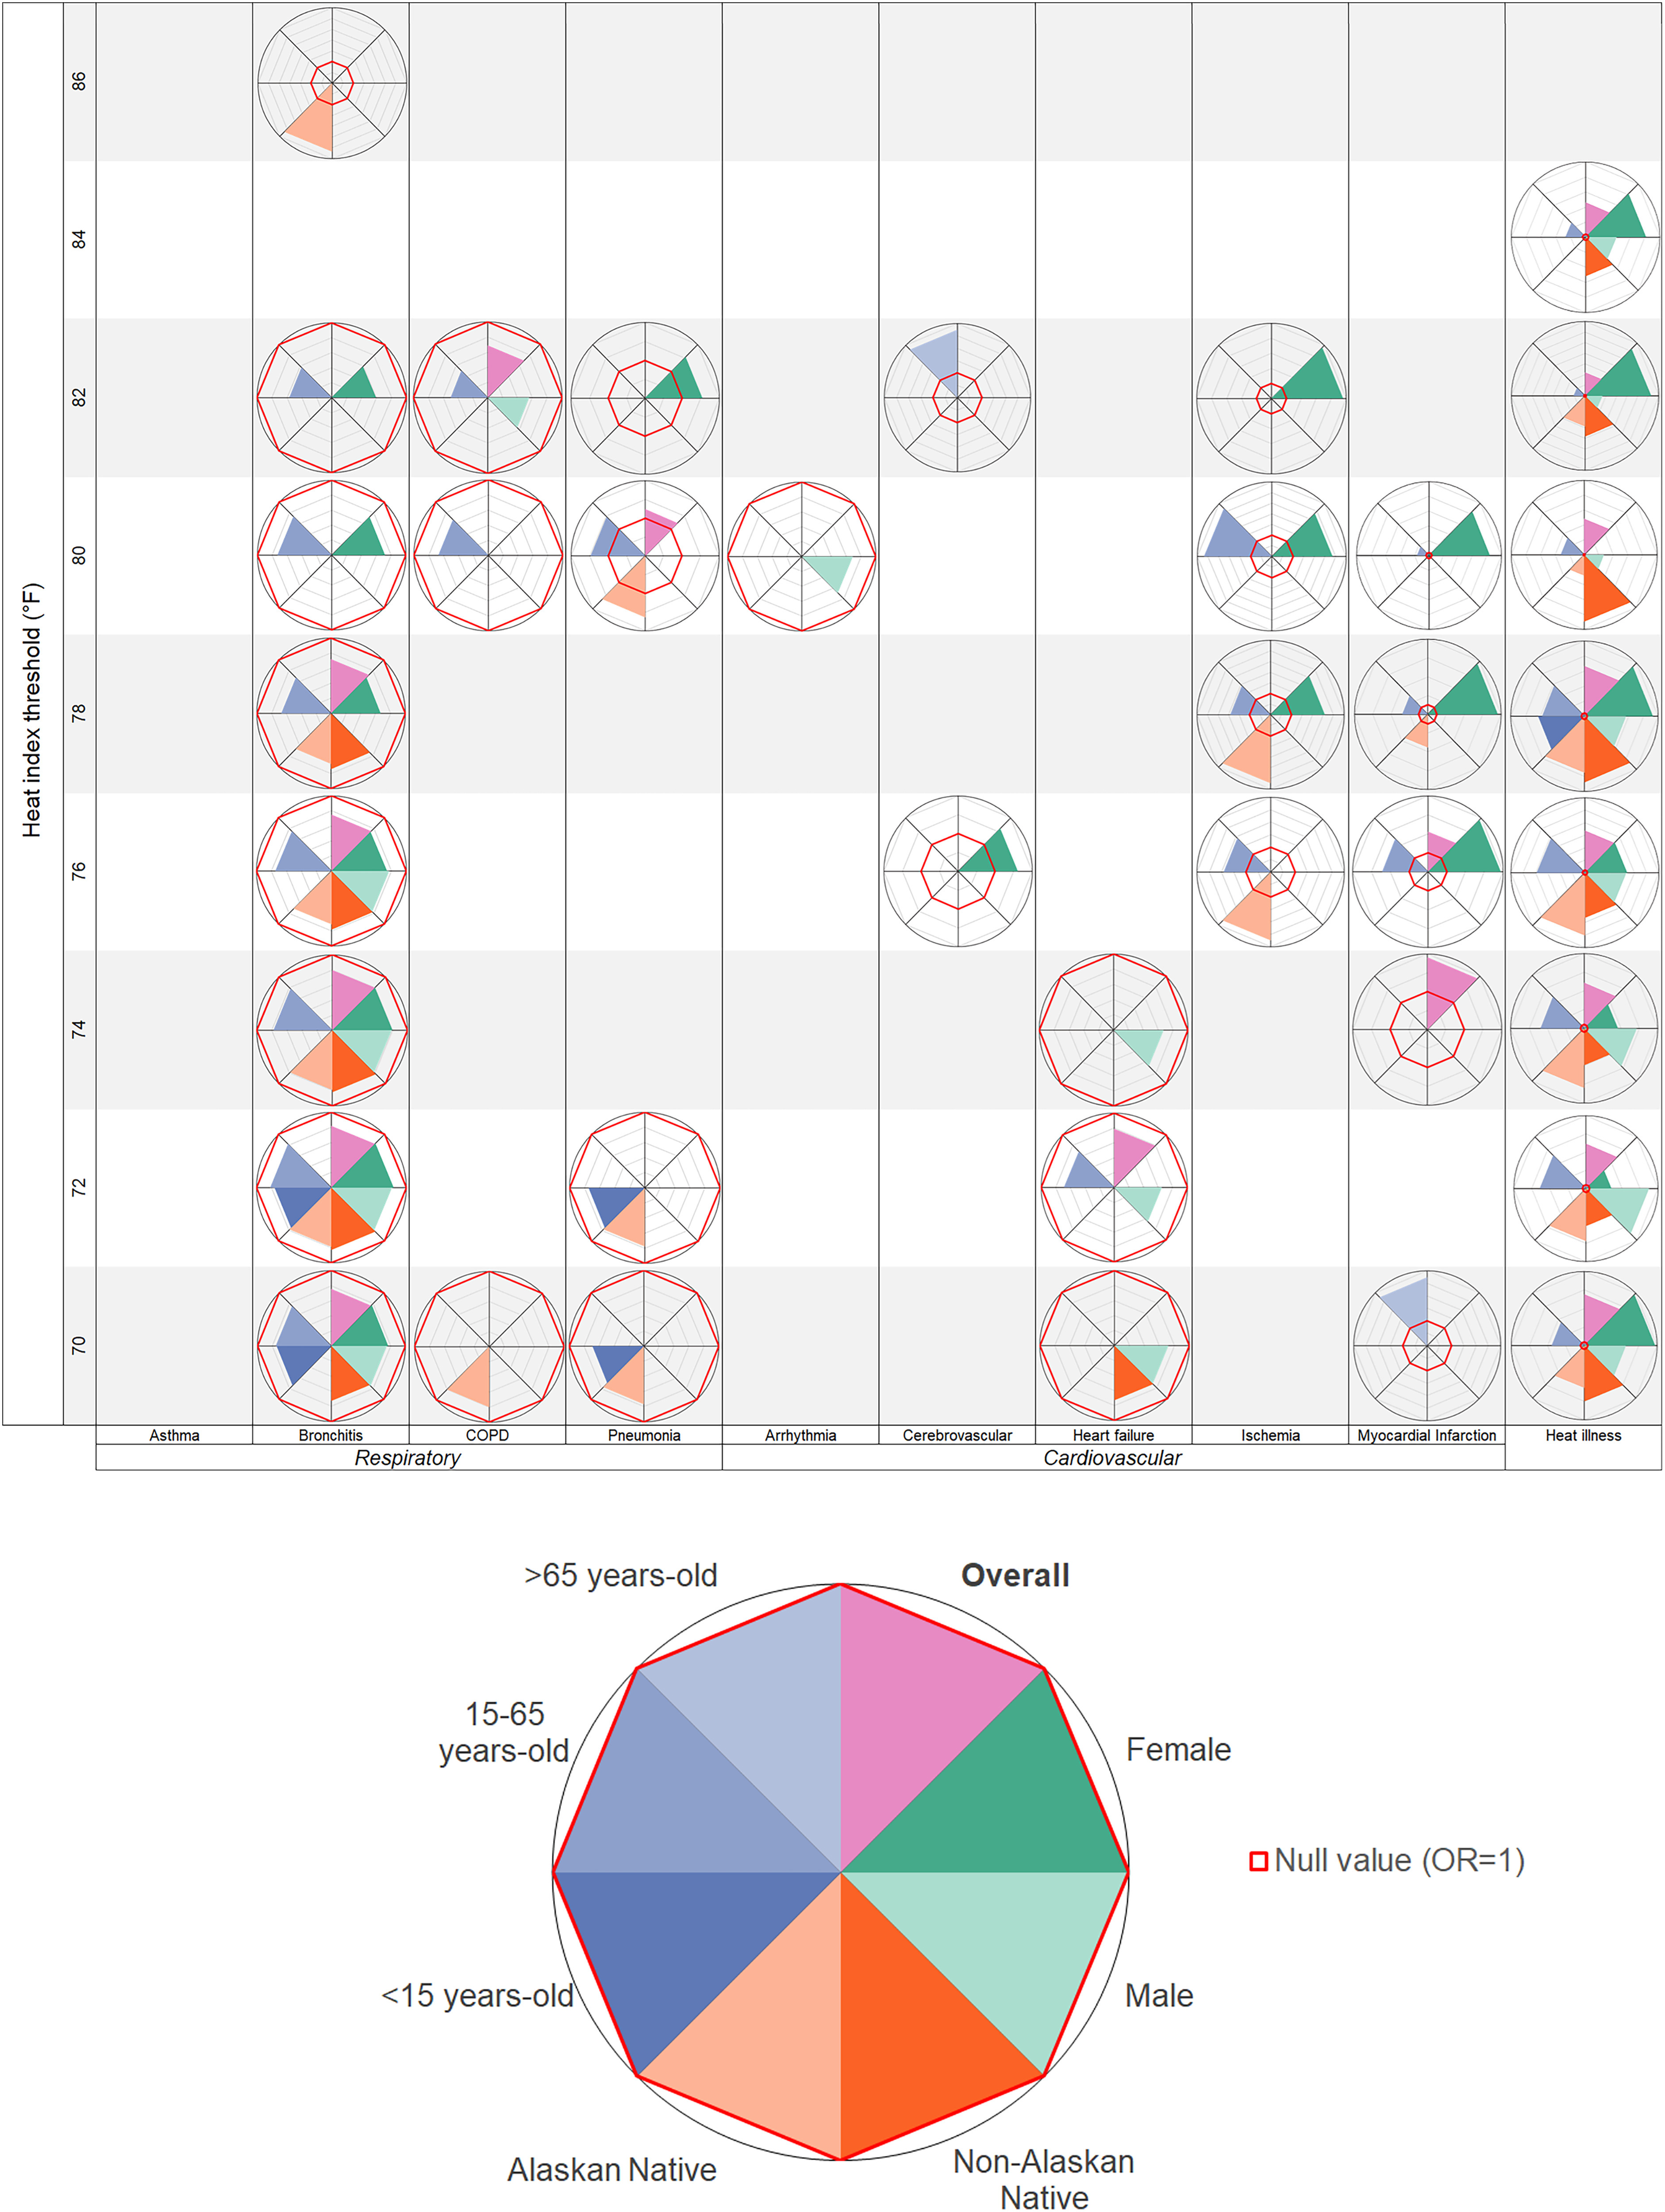
Figure 1.

Figure 1 is a set of one graph and one pie chart. The graph, plotting heat index threshold (degrees Fahrenheit), ranging from 70 to 86 in increments of 2 (y-axis) across Respiratory, including Asthma, Bronchitis, C O PD, and Pneumonia; Cardiovascular, including Arrhythmia, Cerebrovascular, heart failure, Ischemia, Myocardial Infraction; and Heart illness (x-axis). The pie chart is a key for the graph and shows which demographic groups are shown in the graph above. The pie chart displays the following information: Overall, female, male, non-Alaskan Native, Alaskan Native, less than 15 years old, 15 to 65 years old, greater than 65 years old, and null value.

Summary of significant odds ratios for cardiorespiratory-related emergency department visits on days above vs. below the heat index (HI) threshold by demographic group in Anchorage, Fairbanks, and the Matanuska-Susitna Valley, Alaska, 2015–2019. Note: Complete results of stratified threshold analyses can be found in the supplementary materials (Tables S1a–l, Tables S2a–l, Tables S3a–r).