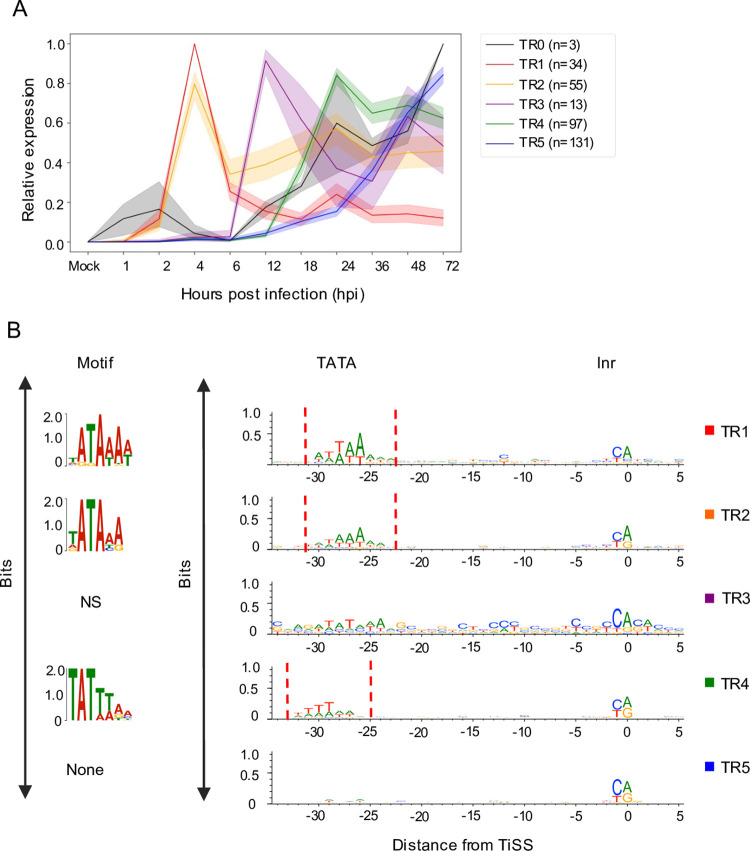
Fig 5. Transcription kinetics of viral TiSS.
A. Graphical depiction of 6 clusters (TR0-5) of viral TiSS obtained by manual classification (for criteria see Methods) based on new RNA derived from the dSLAM-seq data (relative expression levels shown) computed similarly as in Fig 4D. B. Graphical and sequence logo depiction of core promoter motifs identified for TR0-5 clusters through MEME motif analysis computed as in Fig 4E. Please note that the TATA-/TATT-box motif in cluster TR4 is shifted by 2 nt to the left compared to cluster TR1. The TR3 cluster did not enrich for a specific motif, which is at least in parts due to the small number of TiSS (n = 13) in this cluster. TBM: TATA-box like motif, Inr: Initiator element, NS: Not significant.

