Abstract
Myelin degeneration occurs in neurodegenerative diseases and aging. In these conditions, resident oligodendrocyte precursor cells (OPCs) differentiate into oligodendrocytes that carry out myelin repair. To investigate the cellular dynamics underlying these events, we developed a noninflammatory demyelination model that combines intravital two-photon imaging with a single-cell ablation technique called two-photon apoptotic targeted ablation (2Phatal). Oligodendrocyte 2Phatal in both sexes results in a myelin degeneration cascade that triggers rapid forms of synchronous remyelination on defined axons. This remyelination is driven by oligodendrocytes differentiated from a subset of morphologically distinct, highly branched OPCs. Moreover, remyelination efficiency depends on the initial myelin patterns, as well as the age of the organism. In summary, using 2Phatal, we show a form of rapid synchronous remyelination, mediated by a distinct subset of OPCs, capable of restoring the original myelin patterning in adulthood but not aging.
INTRODUCTION
Myelination increases neural circuit processing speed and efficiency1,2. Many neurodegenerative conditions result from myelin dysfunction and myelin is one of the earliest structures to degenerate in aging3-5. The cellular mechanisms that allow for the continued refinement and myelin plasticity observed in adulthood6-8 are thought to be co-opted for myelin repair. Yet, it is not fully known how these cycles of degeneration and repair occur at the cellular level, in vivo.
Remyelination is primarily carried out by resident, self-renewing oligodendrocyte precursor cells (OPCs), which can differentiate into oligodendrocytes throughout life9,10. OPCs are dynamic, engaging in tissue surveillance, response to damage, and remyelination11-14. There is some evidence that functional heterogeneity within the OPC population exists15-20. Importantly, however, the precise cellular dynamics and spatiotemporal responses by OPCs to the death of oligodendrocytes and loss of myelin are not well understood. Moreover, it has yet to be determined whether distinct subsets of OPCs participate in oligodendrocyte replacement.
Certain axons exhibit an increased propensity for becoming myelinated, with proper neural circuit function being dependent on this specificity and the myelin patterning along these axons6,21-23. A combination of neural activity and biophysical properties are key modulators myelination24-27. Recent studies suggest that both sensory experience28 and developmental myelin patterning29,30 are important for remyelination success, suggesting that remyelination proceeds through similar checkpoints used during development.
Here we developed a method of focal cortical demyelination, 2Phatal (2-Photon apoptotic targeted ablation), that does not compromise adjacent cells or the subsequent repair by OPCs. 31. This approach enabled the investigation of the precise dynamics of oligodendrocyte degeneration, OPC fate during demyelination, and spatiotemporal patterns of remyelination, in the live mouse cerebral cortex. Remyelination timing and success was biased towards axons with more complete myelin coverage. In some cases, the spatiotemporal dynamics of remyelination resulted in near seamless transitions from sheath degeneration to repair, a process we call synchronous remyelination. This remyelination was driven primarily by subsets of OPCs with increased process branching. Notably, the morphologically complex OPCs did not express markers of premyelinating oligodendrocytes confirming that they were not actively differentiating. Moreover, morphologically simple OPCs expressed GPR17 while morphologically complex OPCs did not, providing additional clues into the diverse functional states of this cell population at early stages of repair initiation. Finally, spontaneous myelin degeneration in aged mice resembled 2Phatal induced oligodendrocyte degeneration and cuprizone intoxication, suggesting a common mechanism of cell death in aging and these models. Consistent with past aging studies, remyelination after 2Phatal was compromised in aged animals, due to the lack of oligodendrogenesis. Thus, we describe a new model of demyelination and use it to reveal the dynamics of and cell populations involved in remyelination.
RESULTS
2Phatal as an in vivo model of cortical demyelination
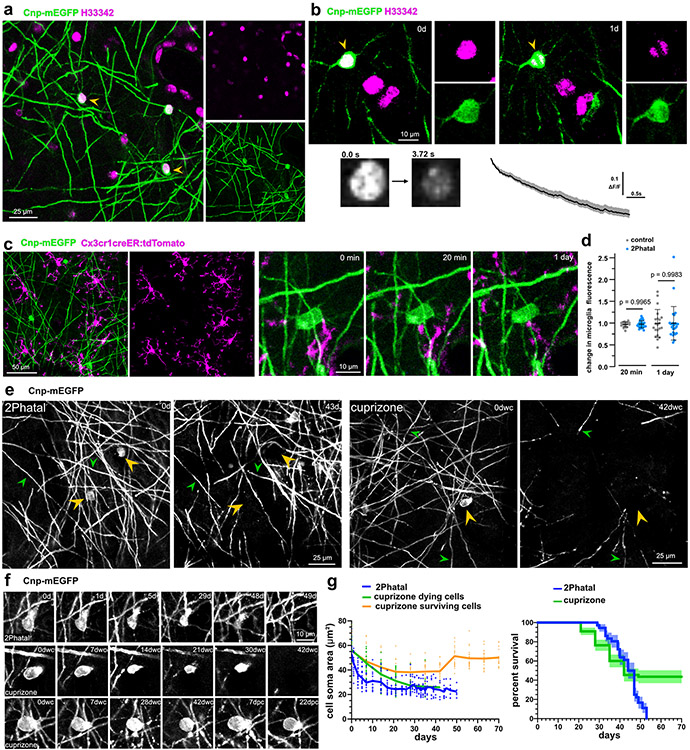
We used 2Phatal to establish an on-demand, single oligodendrocyte demyelination model in live mice, which combines nuclear dye labeling with two-photon mediated photobleaching to induce DNA damage and cell death31,32. Hoechst 33342 application to the cortical surface during a cranial window surgery provides nuclear labeling of cells within the region (Fig. 1a). Combining Hoechst labeling with transgenic mice expressing membrane EGFP in myelinating oligodendrocytes (Cnp-mEGFP)33,34, enabled identification of oligodendrocyte nuclei (Fig. 1a). Irradiation of single oligodendrocyte nuclei with a two-photon laser (8x8μm region, 125 scans lasting 3.72s, see methods) resulted in consistent Hoechst photobleaching without disrupting cytostructural integrity, as evidenced by no change in the mEGFP of targeted oligodendrocytes (Fig. 1b). To determine if the photobleaching caused cell rupture, we assessed the activity of adjacent microglia (Fig. 1c, Extended Data Fig. 1). There was no polarization of microglia towards targeted cells, 20 minutes and 1 day after photobleaching (Fig. 1d; n=21 control and 27 2Phatal cells from 3 mice, one-way ANOVA, Sidak’s multiple comparisons test). This is in contrast to the immediate chemotactic response by microglia following thermal cell ablation31,35. While some fluorescence measurements changed 1 day after photobleaching, this was due to microglia migration adjacent to the targeted cell but no phagocytic or chemotactic response (Fig. 1d, Extended Data Fig. 1).
Fig. 1 ∣. On-demand focal cortical demyelination with oligodendrocyte 2Phatal.
(a) In vivo image of nuclear dye labeling (magenta) in the somatosensory cortex of a Cnp-mEGFP transgenic mouse with oligodendrocytes labeled via membrane tethered EGFP (arrowheads). (b) Photobleaching of single oligodendrocyte nuclei (arrowhead, 3.72s bleach) caused disruption of nuclear labeling without causing damage to adjacent cells. Reliable photobleaching is shown by the average fluorescence intensity trace for all targeted cells (n=82 cells, 6 mice, error bands are SEM). (c) In vivo images from dual-reporter, triple transgenic mice with oligodendrocytes (green) and microglia (magenta) labeling. Microglia exhibited no immediate chemotactic response towards oligodendrocytes targeted with 2Patal (yellow arrowheads) demonstrating no disruption of the targeted oligodendrocyte cell membrane during 2Phatal photobleaching. (d) The change in microglia fluorescence intensity was quantified before, 20 minutes, and 1 day after photobleaching in 2Phatal and control cells (n=21 control cells and 27 2Phatal cells, 3 mice, one-way ANOVA, Sidak’s multiple comparisons test, error bars are SD). (e) In vivo time lapse images showing oligodendrocyte cell loss (yellow arrowheads) and demyelination in 2Phatal (left) and cuprizone fed (right) mice. Green arrowheads denote points of reference for position orientation. (f) Representative timeseries of oligodendrocytes targeted with 2Phatal, oligodendrocytes dying during cuprizone treatment, and oligodendrocytes that survive cuprizone intoxication. 2Phatal was induced on 0d, with final degeneration occurring 7 weeks later (dwc = days with cuprizone; dpc = days post cuprizone). In all 3 cases, soma morphology is disrupted within 7 days of initial insult. Cells that survive cuprizone treatment resume normal morphology after the mice are returned to normal chow. (g) Changes in oligodendrocyte soma area (μm2) of cells targeted with 2Phatal (blue; n=24 cells, 4 mice), dying cells in mice treated with cuprizone (green; n=31 cells, 3 mice), and surviving cells in mice treated with cuprizone (orange; n=24 cells, 3 mice) and survival curve of oligodendrocytes after 2Phatal (blue, n = 36 cells, 4 mice) or in mice treated with cuprizone (green; n=55 cells, 3 mice) (error represents SEM).
After photobleaching of single oligodendrocytes, longitudinal imaging revealed that oligodendrocyte cell soma condensed over the first week before disappearing, on average, 44 days after 2Phatal (n=36 cells, 4 mice, Fig. 1e-g, Supplementary Videos 1,6). Importantly, only targeted cells degenerated, allowing for the generation of new oligodendrocytes throughout the experiment (Fig. 1e).
To determine if the cuprizone demyelination model followed similar dynamics to 2Phatal we imaged mice that were fed cuprizone for 6 weeks, followed by 4 weeks of normal chow (Extended Data Fig. 1). Cuprizone caused widespread oligodendrocyte and myelin loss with oligodendrocyte death occurring after persistent cell soma condensation on average 34 days into the treatment (n=31 cells, 3 mice, Fig. 1e-g, Extended Data Fig. 1-2). Unlike 2Phatal however, which resulted in the death of 100% of the targeted cells, oligodendrocyte degeneration from cuprizone was incomplete, with 56% of the imaged cells dying throughout the imaging period. Oligodendrocytes that survived cuprizone exhibited reversible soma condensation (Fig. 1e-g). The similarities between 2Phatal and cuprizone, in terms of timing and morphological progression of cell death, suggest that 2Phatal causes an intrinsic response by oligodendrocytes, likely mimicking neurodegenerative conditions and aging.
Myelin degeneration proceeds via retraction and decompaction
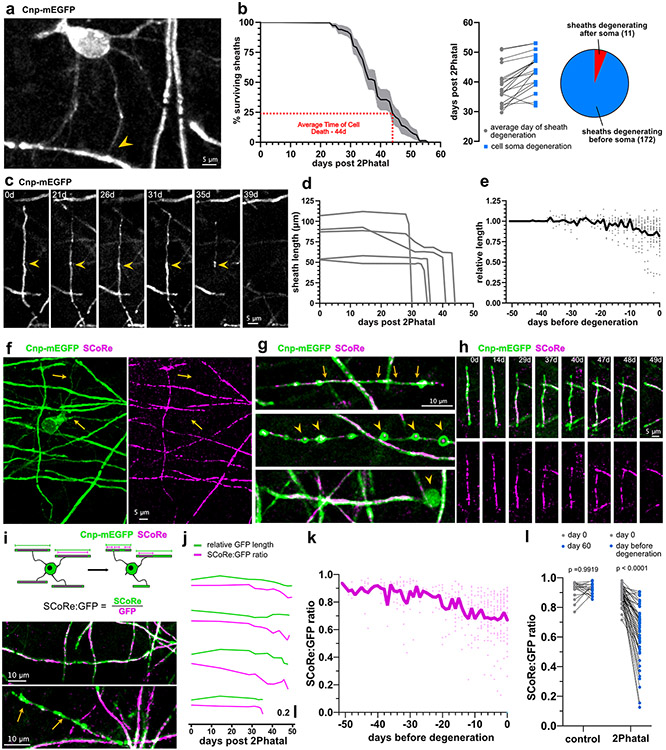
In depth analyses of 183 sheaths from 19 targeted oligodendrocytes revealed that 94% of sheaths degenerated prior to the loss of their attached oligodendrocyte soma (Fig. 2a-b). This suggested a temporally linked sequence of soma and sheath degeneration. Even with this temporally synchronized process however, the degeneration of all sheaths attached to a single oligodendrocyte occurred over days, indicating a drawn-out degenerative mechanism, rather than a single death event (Fig. 2b). Myelin sheath degeneration involved retraction, thinning, and formation of myelin swellings (Fig. 2c-e). Sheath retraction was most prominent in the 10 days prior to sheath loss (Fig. 2e; n=49 sheaths, 4 mice), while thinning and formation of myelin swellings occurred throughout the degeneration.
Fig. 2 ∣. Myelin sheath degeneration occurs via distinct phases of retraction and membrane decompaction.
(a) In-vivo imaging of CNP-mEGFP reveals oligodendrocyte proximal processes and their connection with the myelin sheath (arrowhead). (b) Temporal dynamics of sheath degeneration. (n=19 cells, 183 sheaths, 4 mice, error is SEM). Average time to sheath degeneration compared to cell soma loss and breakdown of sheaths degenerating before or after their attached soma for all sheaths analyzed. (c) In vivo image sequence of a myelin sheath thinning and retracting over weeks after 2Phatal. (d) Representative length changes of sheaths produced by one 2Phatal-targeted oligodendrocyte. (e) Relative length changes in all myelin sheaths leading up to the day of their degeneration (gray dots indicate single sheath measurements, n = 49 sheaths, 4 mice). The overlayed black trace represents the mean. (f) In vivo image indicating that the SCoRe (myelin compaction) signal is absent from proximal processes (arrows). (g) Common myelin sheath pathology observed during 2Phatal induced degeneration, including sheath thinning (top, between arrows), balloon formation (middle, arrowheads) and myelin debris accumulation (bottom, arrowhead). (h) Representative time sequence of a degenerating sheath visualized with fluorescence and SCoRe microscopy. (i) SCoRe to GFP ratios were calculated to determine SCoRe coverage along myelin sheaths (top). This value was used to distinguish compact sheaths (middle) from uncompacted sheaths (bottom, yellow arrows). (j) Representative traces of GFP length (green) and SCoRe:GFP ratio (magenta) from 4 sheaths. (k) SCoRe:GFP ratios of all internodes normalized to the day of sheath degeneration (n= 9 sheaths, 4 mice). The overlayed blue trace represents the mean. (l) SCoRe:GFP ratios of control and degenerating sheaths at day 0 vs day 60 for control or the day before degeneration for 2Phatal (n=19 control sheaths and n=49 2Phatal sheaths, 4 mice, two-way ANOVA, Holm-Sidak multiple comparisons, comparison of 2Phatal SCoRe:GFP ratio between day 0 and 60 p = 4x10⁻¹⁵).
SCoRe microscopy enables label-free visualization of compact myelin (Fig. 2f)34,36,37. Combining this technique with fluorescence microscopy enabled the quantification of changes in sheath compaction throughout degeneration (Fig. 2g-h). Changes in SCoRe were reported as a ratio of total SCoRe length to mEGFP sheath length (Fig. 2i). While the timing of decompaction varied between sheaths, the average SCoRe:GFP ratio decreased steadily during degeneration (Fig. 2j-k). Loss of compaction was most severe immediately prior to sheath loss, with decompaction observed in control non-targeted sheaths (Fig. 2l; n=19 control sheaths and 49 2Phatal sheaths, 4 mice, paired t-tests with Holm-Sidak multiple comparisons correction). Decompaction was observed up to 20 days prior to sheath degeneration, suggesting that severely disrupted, non-compact myelin can persist without being removed from the axon for weeks (Fig. 2j-k). These data show that oligodendrocyte death results in protracted myelin deterioration, characterized by decompaction and sheath thinning.
Focal OPC response to oligodendrocyte death and demyelination
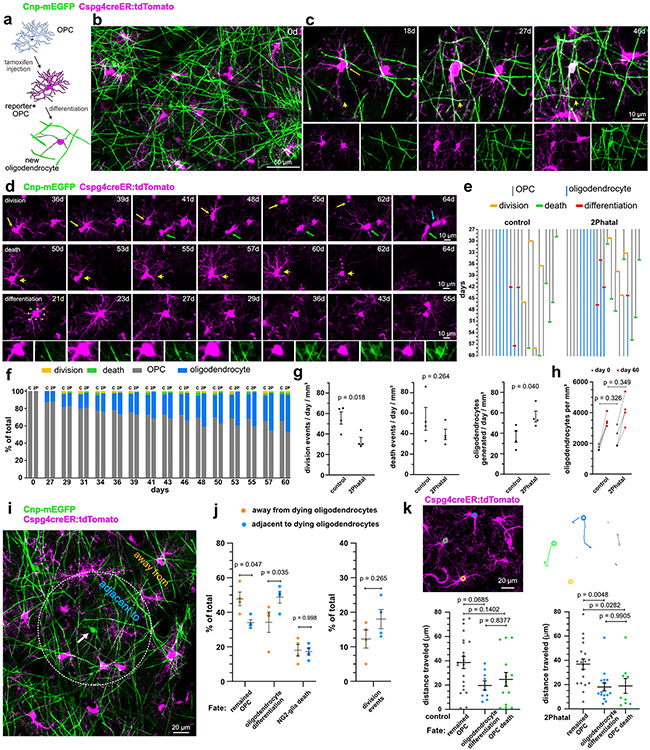
To determine how OPCs dynamically responded to 2Phatal induced demyelination we employed a new triple transgenic mouse line capable of discriminating OPCs from myelinating oligodendrocytes. These mice have mEGFP in myelinating oligodendrocytes and tamoxifen inducible tdTomato in OPCs and their progeny, Cnp-mEGFP:Cspg4-creER:tdTomato (Fig. 3a-c, Extended Data Fig. 2, Supplementary Videos 5,6). Oligodendrocyte differentiation from OPCs was identified by the appearance of mEGFP expression, resulting in double-labeled (tdTomato+mEGFP+) myelinating oligodendrocytes (Fig. 3c, Extended Data Fig. 2, Supplementary Video 4).
Fig. 3 ∣. Divergent fates of single OPCs after oligodendrocyte 2Phatal.
(a) Dual color fate mapping of OPCs in Cnp-mEGFP:Cspg4-creER:tdTomato mice with an inducible cre reporter. (b) In vivo image of OPCs (magenta) and myelinating oligodendrocytes (green) immediately following cre recombination. (c) OPC differentiation into a dual-labeled myelinating oligodendrocyte (arrows). New myelin sheaths generated during differentiation are dual-labeled (arrowheads). (d) In vivo time-lapse images showing outcomes for OPC fate including cell division (top) cell death (middle) and oligodendrocyte differentiation (bottom, boxed area shows the Cnp-mEGFP channel indicating the turning on of mEGFP as the cell differentiates). (e) OPC lineage diagrams indicating division events (orange), apoptosis (green), and oligodendrocyte differentiation (red) in control and 2Phatal mice. (f) OPC fate in control (c) and 2Phatal (2P) mice, as a percentage of all cells. (control, n = 182 cells, 4 mice; 2Phatal, n = 256 cells, 4 mice). (g) OPC division events per day (orange), apoptotic events per day (green), and differentiation events per day (blue) in control mice compared to 2Phatal mice (n = 4 mice, unpaired t-tests). (h) Oligodendrocyte density in control and 2Phatal mice at day 0 and day 60 (n = 4 mice, two-way ANOVA, Sidaks multiple comparison’s test). (i) Analysis of OPCs adjacent to or away from oligodendrocytes targeted by 2Phatal. Adjacent cells were defined as those with somas on or within a 150μm diameter circle centered around each targeted cell (arrow). (j) The proportion of all cells that remained OPCs, differentiated, or died in both regions (n = 4 mice, two-way ANOVA Sidaks multiple comparison’s test). Division events between these populations was also quantified (n = 4 mice, paired t test). (k) Tracks of OPC migration in control and 2Phatal mice. Analysis of total distance traveled relative to cell fate for OPCs in control (left) and 2Phatal (right) positions. Dots represent a single cell and horizontal lines indicate the mean (control n = 48 cells, 2Phatal n = 45 cells, error bars are SEM, one-way ANOVAs with Tukey correction for multiple comparisons).
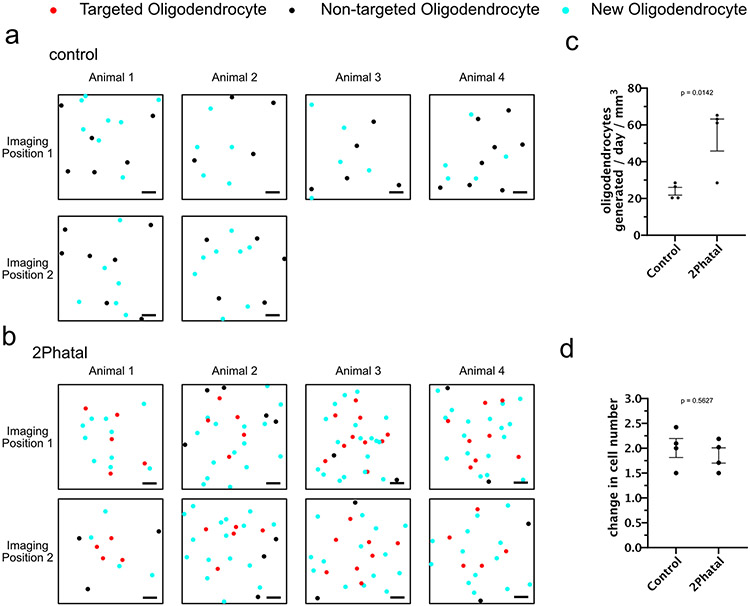
OPC fate was analyzed during peak demyelination and remyelination (days 28-60 after 2Phatal) (Fig. 3d). Documenting division, differentiation, and death events enabled the generation of individualized lineage diagrams of all OPCs (n=182 cells, 4 control mice and 256 cells, 4 2Phatal mice, Fig. 3e, Supplementary Videos 2-4) revealing a significant increase in oligodendrogenesis in the 2Phatal mice, accompanied by a decrease in cell division (Fig. 3f-g; n=4 mice, unpaired t-test, Extended Data Fig. 3). Oligodendrocyte density was not different between control and 2Phatal mice at day 0 and day 60, indicating that the excess oligodendrogenesis compensated for 2Phatal-induced oligodendrocyte death (Fig. 3h, Extended Data Fig. 3; n=4 mice, two-way ANOVA, Sidak’s multiple comparison’s test).
To determine the focality of the OPC response, we analyzed the fate of OPCs located either within, or outside of, a 150μm diameter ROI surrounding targeted oligodendrocytes (Fig. 3i-j). OPCs within this ROI were biased towards oligodendrocyte differentiation while OPCs outside the ROI were more likely to remain OPCs (Fig. 3i-j; n=4 mice, two-way ANOVA, Sidak’s multiple comparison’s test). These data demonstrate the focality of the response and suggest that microregional cues modulate the fate of OPCs.
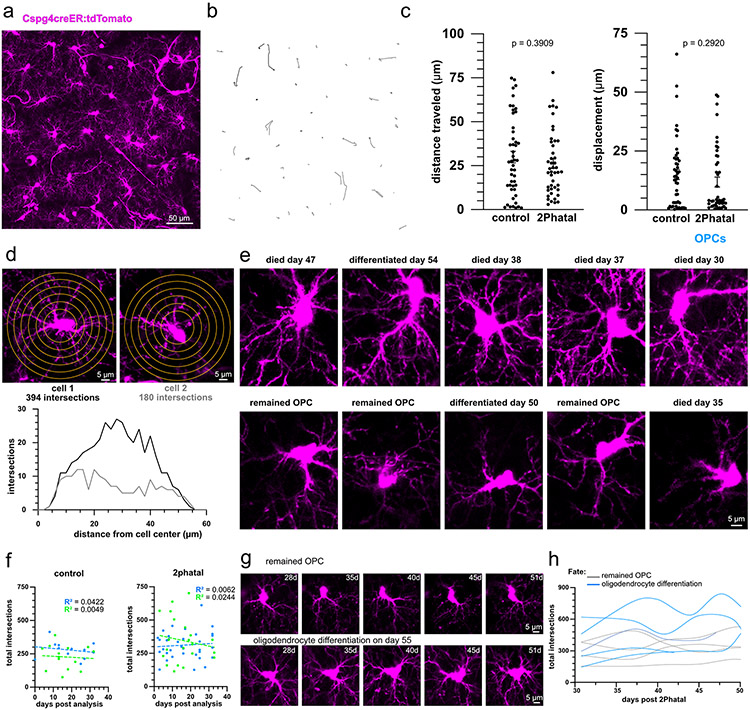
In addition to fate decisions, OPCs can also migrate in the adult brain (Supplementary Video 6). Semi-automated analysis of OPC migration revealed no significant differences in the average total distance traveled or displacement from the original location between OPCs in control and 2Phatal regions (Extended Data Fig. 4; n=48 OPCs, 4 control mice and 45 OPCs, 4 2Phatal mice, unpaired t-test). There was a significant difference in total distance traveled between cells that remained OPCs vs those that either differentiated into oligodendrocytes or died in the 2Phatal condition (Fig. 3k, one-way ANOVA, Tukey’s multiple comparison’s test).
Morphology predicts OPC fate during remyelination
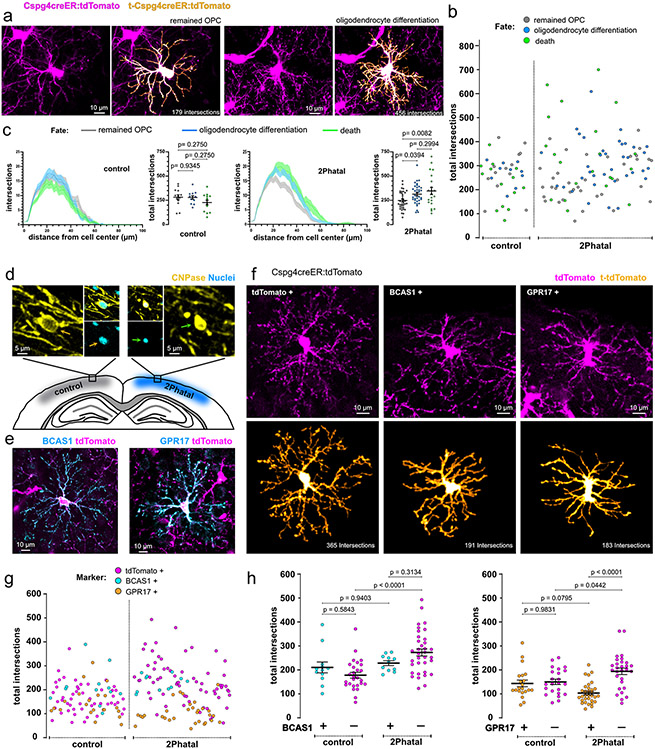
During our analysis of OPC response to demyelination, we noticed varying degrees of OPC morphological complexity. In silico tracing paired with Sholl analyses confirmed this initial observation. Highly branched cells often had 200% more intersections than cells with less complex morphology; in rarer cases, this difference was as much 600% (Fig. 4a-b, Extended Data Fig. 4). Importantly, none of the cells that were analyzed expressed Cnp-mEGFP or were associated with the vasculature, indicating that they were not oligodendrocytes or perivascular mural cells.
Fig. 4 ∣. OPC fate is linked to morphological complexity and GPR17 expression during remyelination.
(a) Semi-automated reconstructions of OPCs with distinct process morphology and eventual fate. (b) The distribution of total intersections of OPCs analyzed using Sholl analysis in control and 2Phatal groups. Each dot represents a single cell and is color coded by fate as indicated. (c) Average Sholl analysis plot of OPCs separated by fate in control (left) and 2Phatal (right) groups (error bars are SEM). Grouped data shows the total intersections of OPCs that remained OPCs (gray), differentiated (blue), and died (green) (control n = 39 cells, 2Phatal n = 93 cells, 4 mice, one-way ANOVA with Holm-Sidak correction for multiple comparisons, error bars are SEM). Each dot represents a single cell, and the horizontal line represents the mean. (d) Representative images of a non-targeted, cortical oligodendrocyte (left, orange arrow) and a 2Phatal targeted oligodendrocyte (right, green arrow) in tissue fixed 28 days post 2Phatal. 2Phatal targeted oligodendrocytes can be identified by the condensation of the soma and nucleus. (e) Representative images showing immunostaining of BCAS1+ (left, cyan) and GPR17+ (right, cyan) OPCs co-labeled by tdTomato. (f) Semi-automated reconstructions of OPCs, positive for tdTomato only (left), tdTomato and BCAS1 (center), and tdTomato and GPR17 (right). (g) The Distribution of total intersections of OPCs in fixed tissue, analyzed by Sholl, in control and multifocal 2Phatal conditions. Each dot represents a single cell and is color coded by the presence of BCAS1 (cyan), GPR17 (orange), or absence of BCAS1 or GPR17 (magenta, tdTomato only). (h) Grouped data showing the total intersections of OPCs in control and 2Phatal conditions, separated by BCAS1 (left, cyan) or GPR17 (right, orange) expression. Cells that do not express either BCAS1 or GPR17 are magenta. (BCAS1+ n = 23 cells, GPR17+ n = 53 cells, tdTomato+BCAS1− n = 62 cells, tdTomato+GPR17− n = 52 cells, 4 animals, one-way ANOVA with tukey correction for multiple comparisons, error bars are SEM, comparison of BCAS1− control to 2Phatal p = 0.000020, comparison of GPR17+ 2Phatal to GPR17− 2Phatal p = 0.0000002).
Using the previously determined OPC fates, we next aimed to identify any differences in fate outcomes between cells with simple and complex morphology (Fig. 4b). OPCs in control regions showed no association between morphological complexity and fate, however OPCs in the 2Phatal group which eventually differentiated into oligodendrocytes or died via apoptosis were more likely to have increased process complexity (Fig. 4b-c). Cells with fewer total processes were more likely to remain OPCs (Fig. 4c; n=93 cells, 4 mice, one-way ANOVA, Holm-Sidak multiple comparison’s test). In contrast to these associations, we did not observe any differences in complexity between cells that divided during the imaging period (non-dividing cells=303±13.5 intersections vs dividing cells=272±30.5 intersections, p=0.337, unpaired t test). OPCs undergo changes in morphological complexity during oligodendrocyte differentiation and death, however we did not find a correlation between process complexity and time to fate outcome post analysis in either control or 2Phatal groups (Extended Data Fig. 4). In fact, the most branched cell in our dataset did not undergo apoptosis until 19 days after Sholl analysis and analysis of single cells over time by performing repeated Sholl analyses on the same cell revealed relatively stable morphological complexity for single cells (Extended Data Fig. 4-5). Taken together, this suggests that differences in process arborization complexity are not differentiating or dying cells, but instead morphologically distinct OPCs with differential fate tendencies under demyelinating conditions.
Morphologically complex OPCs do not express GPR17
To identify a molecular signature of the morphologically diverse OPCs we expanded 2Phatal by performing cranial windows on both hemispheres and ablating up to 291 oligodendrocytes in one window, a variation of the single cell 2Phatal approach we call multifocal 2Phatal (range = 116 to 291 cells, average = 215 cells, 4 mice; Extended Data Fig. 6). Animals were euthanized 28 days after multifocal 2Phatal, matching the time we performed Sholl during our intravital experiments and prior to demyelination. In this way we were able to identify dying oligodendrocytes in fixed tissue brain sections and investigate OPCs surrounding these cells. Sholl analysis of OPCs surrounding 2Phatal oligodendrocytes and randomly selected oligodendrocytes in the control contralateral hemisphere revealed a population of tdTomato-labelled CNP-negative cells with increased complexity specifically on the 2Phatal side (Fig. 4g).
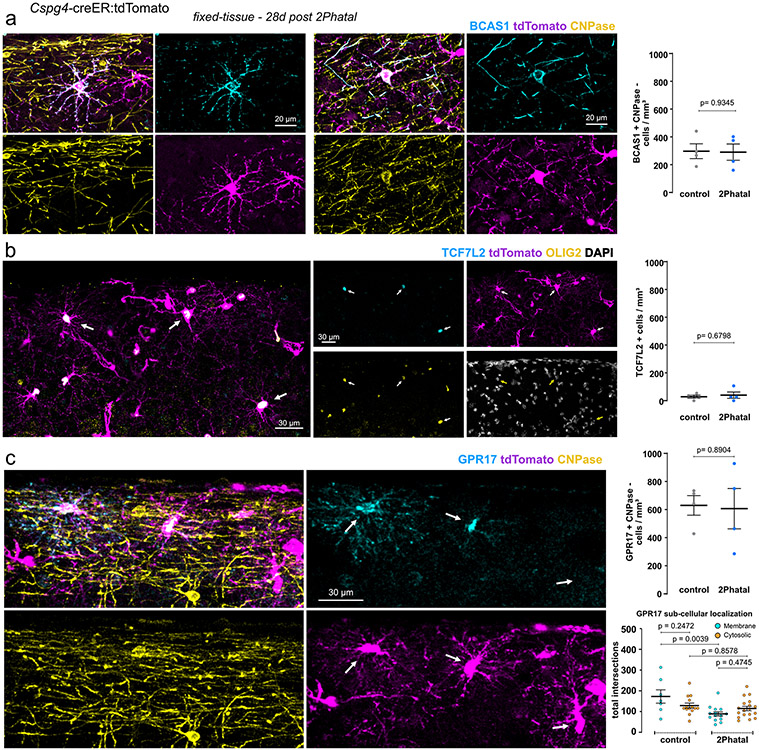
We next confirmed that the complex cells were OPCs and not premyelinating oligodendrocytes. As before, CNP-labeled cells were excluded from Sholl analysis as CNP can be expressed by premyelinating cells. Transcription factor 7-like 2 (TCF7L2) and breast carcinoma amplified sequence 1 (BCAS1) are two other markers expressed in differentiating oligodendrocytes38,39. The density of TCF7L2 labeled cells was not different between the two hemispheres and the cell density did not match the density of complex tdTomato-labeled cells. Moreover, Sholl analysis on the few cells that were present revealed an average of 206±39 intersections per cell (n=6 cells from 4 mice). Importantly, all TCF7L2 positive cells co-labeled with Olig2 showing there were within the oligodendrocyte lineage (Extended Data Fig. 7). Therefore, we moved to BCAS1, as differentiating cells might express BCAS1 for a longer period of time as compared to TCF7L239. This was indeed the case as the density of BCAS1 labeled cells was higher than TCF7L2 (Extended Data Fig. 7). BCAS1 positive cells that had sheaths or co-labeled with CNP were excluded from analysis. The complexity of BCAS1+ cells between the control and 2Phatal hemispheres was not different. In contrast, BCAS1-negative, tdTomato-positive, OPCs were more complex in 2Phatal compared to control regions, indicating that the change in morphology occurs prior to expression of BCAS1 and active differentiation (Fig. 4h).
GPR17 is heterogeneously expressed in OPCs, which makes GPR17 the only established marker of heterogeneity within this cell population40 and a potential distinguishing label of the morphological diversity we observed. Indeed, there was a significant difference in total intersections between the cells that expressed GPR17 specifically on the 2Phatal side (Fig. 4h). Together these data point to GPR17 being directly related to differences in morphological complexity of OPCs during active myelin degeneration and that myelin repair is carried out by a functionally distinct subset of OPCs lacking GPR17.
Remyelination is dependent on the preexisting myelin pattern
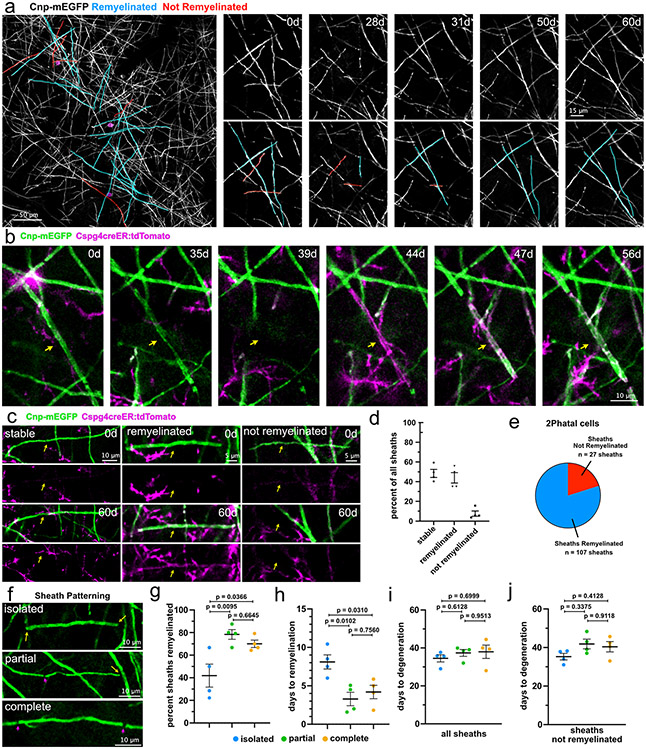
2Phatal does not block OPC differentiation therefore we used Cnp-mEGFP:Cspg4-creER:tdTomato mice to determine the precise dynamics and patterns of remyelination occurring during demyelination (Fig. 5a-b, Supplementary Video 7). First, we examined the full extent of demyelination and repair within each imaging location. A total of 92 sheaths, from 4 mice, were randomly selected on day 0 and evaluated for stability, degeneration without repair, or degeneration with remyelination 60 days later (Fig. 5c). This population of sheaths contained sheaths attached to targeted and non-targeted cells. On average, 48.9±4.2% of sheaths remained stable, 44.1±5.4% degenerated and were repaired, while 7±2.7% degenerated without remyelination (Fig. 5c-d). Focusing on sheaths attached to 2Phatal targeted cells revealed that all sheaths degenerated and 79.9% of those were remyelinated (Fig. 5e). We never observed the loss of sheaths that were not attached to targeted oligodendrocytes, further showing the specificity for damage occurring only to targeted cells.
Fig. 5 ∣. Myelin patterns impact the success and spatiotemporal dynamics of remyelination.
(a) In vivo image showing the locations of oligodendrocytes targeted with 2Phatal (magenta circles) and sheaths which degenerate post 2Phatal, colored based on final fate (cyan, are remyelinated; red, are not remyelinated). (b) Timeseries showing degeneration of a single labeled mEGFP+ myelin sheath (arrow) followed by remyelination by a new, dual-labeled mEGFP+/tdTomato+ sheath from a newly differentiated oligodendrocyte. (c) Representative images of sheaths which remained stable (left), degenerated and were remyelinated (middle), and were lost without repair (right). (d) Proportion of sheath outcomes for randomly selected sheaths within the cranial window. (92 sheaths; n=4 mice, error bars are SEM). (e) The proportion of sheaths attached to 2Phatal cells that were remyelinated (f) Representative images showing the 3 possible myelin patterns. Isolated sheaths (top) had no adjacent sheaths (yellow arrow), partial sheaths (middle) had an adjacent sheath on one side (magenta arrows) and no adjacent sheath on the other (yellow arrow), and complete sheaths (bottom) had two adjacent sheaths (magenta arrows). (g-h) Remyelination efficiency and time to remyelination were quantified based on the myelin patterning of each sheath. Sheaths with partial and complete patterns were more likely to be remyelinated than isolated sheaths (134 sheaths from n=4 mice, one-way ANOVA with Tukey correction for multiple comparisons, error bars are SEM). Remyelination was slower in isolated sheaths compared to the other patterns (107 sheaths from n=4 mice, one-way ANOVA with Tukey correction for multiple comparisons, error bars are SEM). Dots represent the average from each mouse. (i-j) Time to degeneration of all sheaths (i) and only sheaths that were not remyelinated (j) was quantified based on the myelin patterning of each sheath. There was no significant difference in time to degeneration between any of the patterns, for all sheaths (142 sheaths from n=4 mice, one-way ANOVA with Tukey correction for multiple comparisons, error bars are SEM), or for sheaths that were not remyelinated (39 sheaths from n=4 mice, one-way ANOVA with Tukey correction for multiple comparisons, error bars are SEM). Dots represent the average from each mouse.
We next determined how myelin patterning influenced both remyelination efficiency and the time between degeneration and repair. Patterning was defined by the number of sheaths adjacent to the sheath of interest; no adjacent sheaths were termed isolated, while 1 and 2 adjacent sheaths were called partial and complete respectively (Fig. 5f). Only 42% of isolated sheaths were successfully remyelinated, significantly less than both partial (78%) and complete (70%) patterns (Fig. 5g, one-way ANOVA Tukey’s multiple comparison’s test). In addition to there being a differential outcome in terms of remyelination success, there were differences in the time between sheath degeneration and repair. Isolated sheaths that did get remyelinated, took, ~8.5 days to become remyelinated, compared to ~3.8 days for sheaths with 1 neighbor and ~4.8 days for sheaths with 2 neighbors (Fig. 5h, one-way ANOVA Tukey’s multiple comparison’s test). Importantly, there were no significant differences in the time to degeneration based on sheath patterning (Fig. 5i-j).
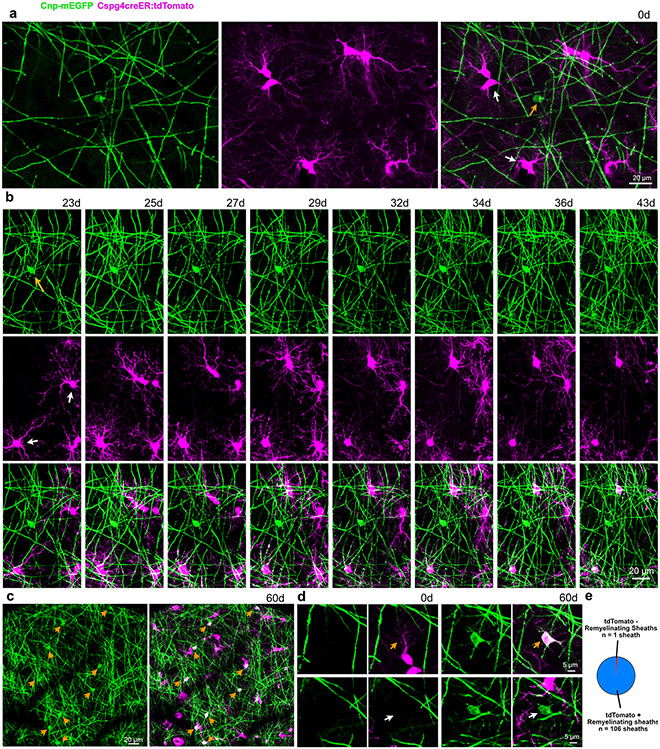
Of all the sheaths analyzed for remyelination 99.1% (106/107) were dually labeled with mEGFP and tdTomato, indicating the remyelination was carried by newly differentiated cells, not adjacent mature oligodendrocytes. We only encountered a single remyelinating sheath that was not dually labeled likely due to incomplete cre recombination (Extended Data Fig. 2).
In addition to remyelination of single sheaths, we also determined if node of Ranvier locations were reestablished. Nodes were randomly selected at day 0 and evaluated for stability, degeneration, or degeneration and re-establishment. Overall, 38.8% of the nodes were stable, 7.5% never reformed, and 53.8% were reestablished (Extended Data Fig. 8, 80 nodes from n=4 mice). Nodes that were stable across the imaging period tended to remain stationary, with 87.1% moving less than 5μm (31 nodes, 4 mice). Although less resilient than stable nodes, 68.3% of regenerated nodes re-formed within 5μm of their original position (43 nodes, 4 mice).
Rapid myelin repair via synchronous remyelination
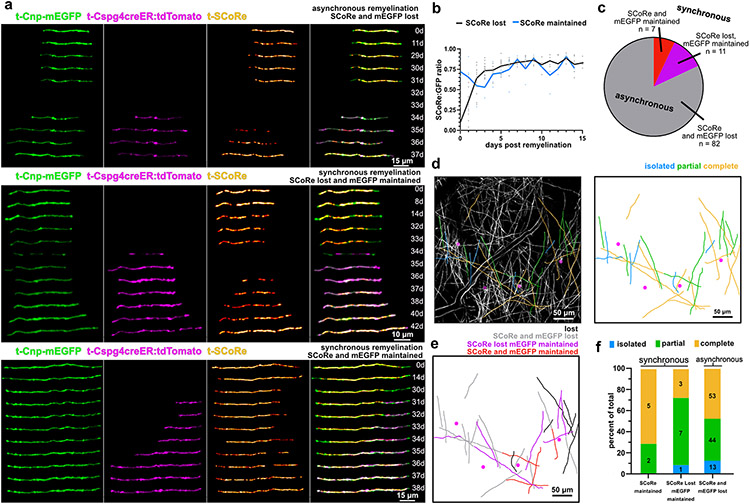
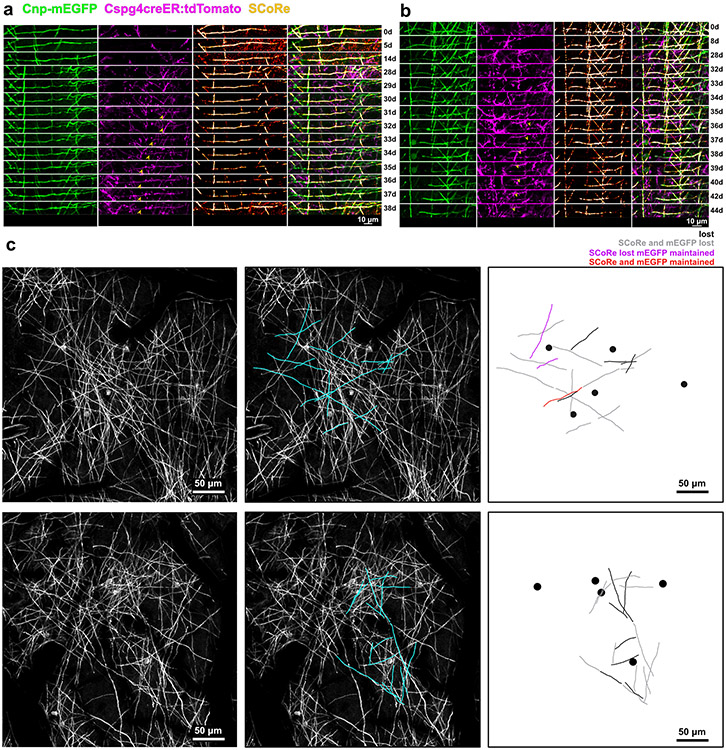
In many sheaths that did get remyelinated we observed a stereotypical spatiotemporal pattern characterized by the loss of the damaged sheath, a period spent in an unmyelinated state, followed by initiation of myelin replacement by the generation of a new myelin sheath from a differentiating OPC (Fig. 6a). We termed this cell behavior asynchronous remyelination. During this process, we observed a delay in visible SCoRe signal arising from the forming fluorescently tagged sheath (Fig. 6a). Measurement of the SCoRe:GFP ratio, revealed that sheath compaction could be delayed by as much as 3 days relative to the start of axon ensheathment (Fig. 6e).
Fig. 6 ∣. Distinct forms of synchronous and rapid remyelination.
(a) In vivo time series showing reconstructed myelin sheaths that degenerate and are replaced by new mEGFP+tdTomato+ double labeled sheaths. In the top sheath there is a two-day window where myelin is absent from the axon. In the middle example timeseries there is no gap in time where mEGFP is completely absent from the axon suggesting that the emergence of the new sheath occurs simultaneously with the loss of the original. The SCoRe signal is lost, however. A third example of remyelination is shown on the bottom that proceeds with a seamless transition between the degenerating and remyelinating sheath. There is no observed gap in the mEGFP signal or the SCoRe signal indicating that compaction is mostly maintained through the repair process. (b) The dynamics of SCoRe coverage, of new remyelinating sheaths, following the complete loss of SCoRe signal (black, n = 19 sheaths, 3 mice) or during a seamless transition event (blue, n = 7 sheaths, 2 mice). (c) the proportion of each type of event (n = 100 sheaths, 4 mice). (d) A reconstruction of an entire position field of view. 2Phatal targeted oligodendrocytes are shown as magenta circles with sheath traces colored to denote the myelin pattern of each sheath (blue, isolated, green, partial, yellow, complete). (e) The same field of view used to generate d, Sheaths produced by these oligodendrocytes are also shown, colored based on ultimate fate (black, not remyelinated, gray, remyelinated with loss of mEGFP and SCoRe , purple, remyelinated with loss of SCoRe but not mEGFP, red, remyelinated without loss of SCoRe or mEGFP) (f) The proportion of sheaths that were observed to be remyelinated by the different remyelination events based on patterning. The value within each bar denotes the n value of sheaths
In addition to asynchronous remyelination, we also observed remyelination occurring synchronously with sheath degeneration (Fig. 6a). This process often occurred following loss of SCoRe in the damaged sheath, but before the full removal of the original myelin sheath (Fig. 6a,c). Although compaction was also delayed in these cases, as before, the time between SCoRe loss and recovery was brief (Fig. 6b).
We also detected synchronous remyelination in which the SCoRe signal was never lost (Fig. 6a,c). Instead, the newly forming sheath invaded the territory of the damaged sheath, replacing it without any noticeable loss of mEGFP signal and minimal loss of SCoRe (Fig. 6a, Extended Data Fig. 9). Post-hoc analysis of these forms of synchronous remyelination related to myelin patterning revealed a bias of this repair towards sheaths displaying partial and complete myelin patterns as this was observed only once on an isolated sheath (Fig. 6d-f, Extended Data Fig. 9).
Disruption of myelin maintenance and repair in aging
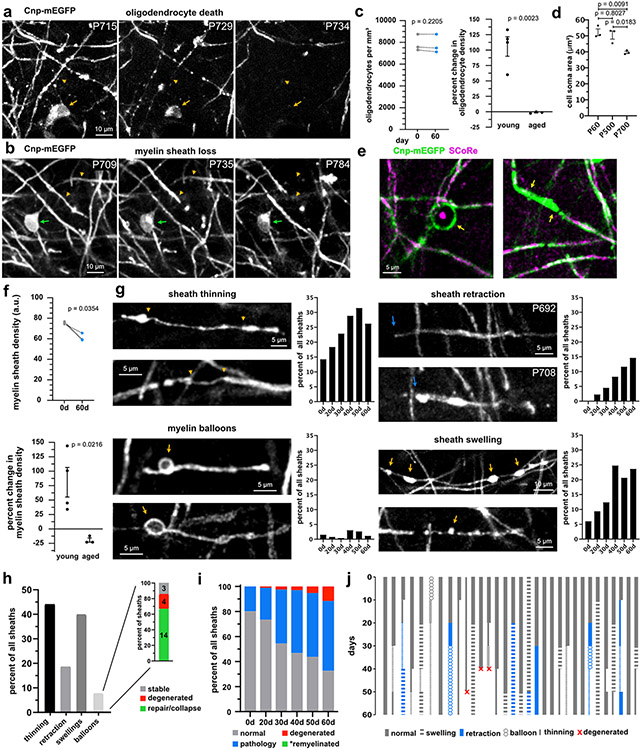
Myelin degenerates early in aging5. Imaging in aged (22-24 months) mice revealed protracted oligodendrocyte and myelin sheath loss that resembled 2Phatal-induced demyelination (Fig. 7a, Extended Data Fig. 10). This included oligodendrocyte soma shrinkage, sheath thinning, formation of myelin swellings/balloons, and decompaction (Fig 7a-e, Extended Data Fig. 10). While stochastic oligodendrocyte death was observed (Fig. 7a), aged mice did not show significant changes in oligodendrocyte density over 60 days of imaging (Fig. 7c; n=3 mice, paired t-test). In contrast, there was a significant decrease in sheath density (Fig. 7f; n=3 mice, paired t-test) showing gradual sheath loss over time (Fig. 7b). The percent change in oligodendrocyte and myelin sheath density over 60 days were significantly different when comparing 2-month-old with aged animals (Fig. 7c,f; n=4 young and 3 aged mice, unpaired t-tests). Moreover, unlike young animals, we rarely observed the generation of new oligodendrocytes in response to oligodendrocyte loss or demyelination. We did observe a single case of oligodendrocyte differentiation which successfully reestablished previous myelin patterning (Extended Data Fig. 10). However, in most cases we observed demyelination with no accompanying oligodendrogenesis or remyelination (Fig. 7a-b,i).
Fig. 7 ∣. Age-related myelin degeneration occurs via sheath loss and cell death with limited repair.
(a) Myelin pathology and degeneration coinciding (yellow arrowhead) with cell death (yellow arrow) b) Myelin sheath degeneration (yellow arrowheads) without cell death (green arrow). (c) Oligodendrocyte densities in aged (22-24 months) mice over 60 days (n=3 mice, two-tailed, paired t-test) and the percent change in oligodendrocyte density between young (2 months) and aged mice (young n=4 mice, aged n=3 mice, unpaired t-test, error bars are SEM). (d) Oligodendrocyte soma area from young mice (P60; n=3 mice, 24 cells) and aged mice (P500; n=3 mice, 90 cells, P700; n=3 mice, 63 cells, one-way ANOVA with Tukey correction for multiple comparisons, error bars are SEM). (e) Commonly observed myelin pathology in aged mice including balloon formation (left, arrow) and loss of compaction (right, between arrows), visualized by loss of SCoRe signal. (f) Myelin sheath densities in aged mice over 60 days (n=3 mice, two-tailed, paired t-test). Myelin sheath density increased in young mice between day 0 and day 60, while decreasing in aged mice (young n=4 mice, aged n=3 mice, two-tailed, unpaired t-test, error bars are SEM). (g) Common myelin pathology observed in aged sheaths, sheath thinning (between orange arrowheads), sheath retraction (blue arrow), balloons (orange arrow), and sheath swellings (orange arrows), and their total prevalence over 60 days (n=267 sheaths, 3 mice). (h) Total prevalence of each observed myelin pathology, indicating the percentage of all sheaths that had the specific pathology for least one time point over 60 days. Myelin balloon formation is further broken down into the eventual fate including, balloons that were stable (gray; n=3), balloons that resulted in sheath degeneration (red; n=4), and balloons which formed and then were subsequently repaired (green; n=14). (i) Total breakdown of all sheaths without any observed pathology (gray), with pathology (blue), sheaths that degenerate (red), and sheaths that were remyelinated (green, *we did not observe any remyelination of sheaths analyzed) in aged mice (n=267 sheaths, 3 mice). (j) Myelin sheath fate diagram demonstrating the progression of pathology of a subset of sheaths.
To determine the dynamics of myelin pathology and degeneration in the aged brain, we followed single sheaths over 60 days (Fig. 7g-j; n=267 sheaths, 3 mice). Signs of myelin pathology increased over the course of imaging, with sheath thinning and myelin swellings being the two most common forms of pathology (Fig. 7g-h). Myelin balloons have been documented in postmortem aged brain tissue41. These were frequently observed in the aged animals and often preceded full sheath degeneration (Fig. 7e-i). In some cases, however, balloon formation would occur followed by repair/collapse of the damaged sheath without evidence of demyelination/remyelination (Extended Data Fig. 10, Fig. 7h). These data suggested that the myelin sheath possess a mechanism for acute repair in response to the accumulation of fluid in the periaxonal space42 or between the layers myelin layers.
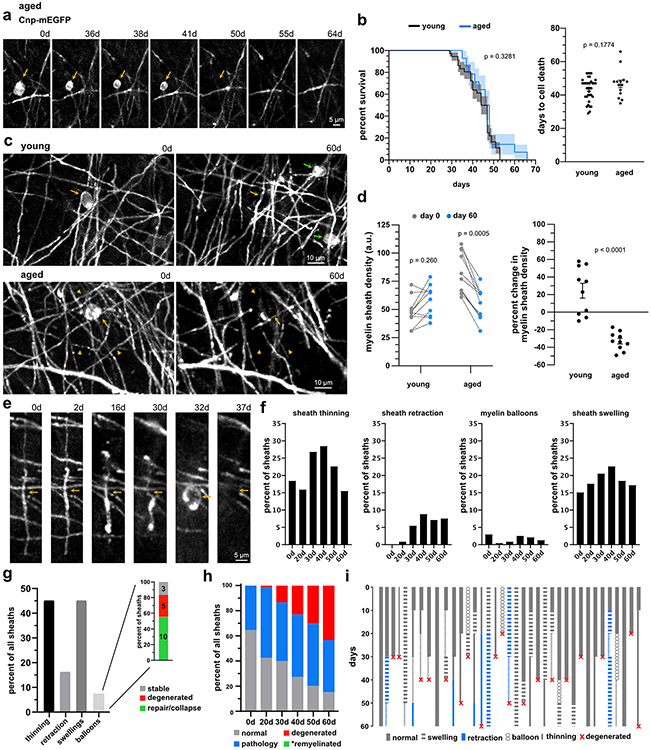
Finally, we targeted single aged oligodendrocytes with 2Phatal. The reliability, timing, and morphological progression was identical to young animals (Fig. 8a-b; n=36 young cells and 14 aged cells, Log-rank test for survival and unpaired t-test for days to death). However, unlike the young mice, there was no oligodendrogenesis or remyelination (Fig. 8c-i). This resulted in a net loss of sheaths around targeted cells in aged but not young animals (Fig. 8c-d; n=10 young cells and 10 aged cells, two-way ANOVA with Sidak’s multiple comparisons test for sheath density and unpaired t-test for percent changes). The degeneration of individual sheaths in the aged brain also mirrored what was observed post-2Phatal in the young brain (Fig. 8e-i). Sheath thinning and swellings were the most observed pathology (Fig. 8f-i; n=239 sheaths, 3 mice). In addition, we saw a marked increase in overall degeneration in 2Phatal animals as compared to control aged cortex (Fig. 8h). Importantly however, we did not encounter any instances of remyelination following 2Phatal, indicating that the presence of increased demyelination is ineffective at stimulating oligodendrogenesis. Thus, remyelination fails after both spontaneous and experimental demyelination in the aged cortex.
Fig. 8 ∣. Failed myelin repair after oligodendrocyte 2Phatal in aging.
(a) Time-series of an aged oligodendrocyte (arrow) degenerating following 2Phatal. (b) Survival curves of oligodendrocytes after 2Phatal in young (n=36 cells, 4 mice) and aged mice (n=14 cells, 3 mice) (log rank (mantel cox) test, error bars are SEM). The average time to oligodendrocyte death after 2Phatal in young and aged mice (two-tailed, unpaired t-test, error bars are SEM). (c) Changes in myelin (orange arrowheads) and oligodendrogenesis (green arrows) in the territory of an oligodendrocyte targeted with 2Phatal (orange arrows), in a young (top) and aged mouse (bottom). (d) The change in myelin sheath density between day 0 and day 60 in the territory surrounding an oligodendrocyte targeted with 2Phatal, in young (n=10 cells, 4 mice,) and aged mice (n=10 cells, 3 mice, two-way ANOVA with Sidak correction for multiple comparisons). The change in sheath density in young mice and aged mice (young n=10 cells, 4 mice, aged n=10 cells, 3 mice, two-tailed, unpaired t-test, error bars are SEM, p = 0.000006). (e) Time-series showing the degeneration of a myelin sheath (orange arrow) over weeks in an aged animal with oligodendrocytes targeted with 2Phatal. (f) The percentage of sheaths exhibiting thinning, retraction, balloons, or swellings over 60 days after 2Phatal (n=239 sheaths, 3 mice). (g) Total prevalence of each observed myelin pathology in 2Phatal mice (n=239 sheaths, 3 mice) that had the specific pathology for least one time point over 60 days of imaging. Myelin balloon formation is subdivided into the eventual fate of observed balloons including, balloons that were stable through the cessation of imaging (gray; n=3), balloons that resulted in sheath degeneration (red; n=5), and balloons which formed and then were subsequently repaired (green; n=110). (h) Total breakdown of all sheaths without any observed pathology (gray), with pathology (blue), sheaths that degenerate (red), and sheaths that were remyelinated (green, *we did not observe any remyelination of sheaths analyzed) in aged mice that were targeted with 2Phatal (n=239 sheaths, 3 mice). (i) Myelin sheath fate diagram demonstrating the progression of pathology of a subset of sheaths.
DISCUSSION
Several powerful demyelination models exist, however, many illicit widespread systemic effects and some directly impact OPC differentiation3,13,30,43-46. To circumvent some of these challenges, we developed 2Phatal for use as a targeted, titratable, non-inflammatory, model of demyelination. Combining 2Phatal with intravital imaging, enabled the discovery of several features of myelin degeneration and repair, including its effects on local OPC behavior. First, we discovered that structural myelin disruption and decompaction occurs days to weeks prior to full demyelination, indicating that axonal function is likely impaired earlier than previously thought. Second, remyelination occurs more rapidly and efficiently along heavily myelinated axons, with some sheaths never fully losing compaction between degeneration and repair through a process called synchronous remyelination. Third, remyelination is predominantly carried out by highly branched OPCs lacking GPR17 expression. Finally, we found that age-related demyelination proceeds with similar spatiotemporal dynamics and morphological progression to both 2Phatal and cuprizone induced degeneration. Taken together, these data demonstrate rapid forms of remyelination, carried out by a local subpopulation of demyelination activated OPCs. They further suggest that oligodendrocyte degeneration, in response to oxidative damage caused by 2Phatal, cuprizone, and aging, proceeds through conserved pathways, making 2Phatal a powerful approach for investigating these mechanisms in the context of aging and disease.
Past spatiotemporal analyses of changes in myelin compaction are limited as electron microscopy has traditionally been needed. Combining fluorescence and SCoRe imaging, enables the direct characterization of sheath compaction over time34,36,37. Previous work has revealed the timing of sheath initiation47, mechanisms controlling sheath compaction, and the general distributions of sheath compaction at different development states48,49. Building on this, we find that of myelin compaction follows sheath initiation by ~24 hours, in the context of remyelination, while complete compaction is not achieved until 3-5 days post initiation. SCoRe imaging also uncovered a rapid form of synchronous remyelination, with an almost uninterrupted transition between sheath degeneration and formation of a new compact myelin sheath. The lack of SCoRe loss notably decreased the time each axon spent without compact myelin. Thus, synchronous remyelination points to the existence of strong positive regulators of myelination produced by the axons. In fact, like propensity and timing for remyelination, myelin patterning was a strong predictor of synchronous remyelination, as 94% of all sheaths exhibiting synchronous remyelination were found on axons with partial or complete myelin patterns.
Previous work has focused primarily on understanding the molecular mechanisms that govern myelin loss, as well as how demyelination proceeds on a macro level. In the cuprizone model, for example, it is well established that demyelination occurs steadily over weeks, with peak demyelination happening at 6 weeks46. However, little is known about how demyelination proceeds on the single cell level, with recent intravital imaging experiments providing critical insight into the remyelination process after cuprizone cessation28,29. Our observations suggest that demyelination, in response to oxidative DNA damage, occurs via the gradual loss and shedding of myelin sheaths from oligodendrocytes. Adding to this finding, the loss of SCoRe signal over the course of degeneration shows that decompaction occurs in advance of sheath loss, likely negatively impacting the function of ensheathed axons prior to demyelination. While there is evidence for decompaction in the aged brain41, the dynamics and functional consequences to the single axon are not understood.
Recent studies have shown remyelination by mature oligodendrocytes via postmortem analysis of shadow plaques in MS tissue50,51, intravital imaging studies in mice exposed to cuprizone28, and in a zebrafish model via activation of TRPV1 channels in oligodendrocytes52. Using our dual-reporter system, we found no evidence of pre-established myelinating oligodendrocytes participating in remyelination. Clearly the cellular scale and molecular insult of single cell 2Phatal demyelination is different from both cuprizone intoxication and MS which could account for this difference. Moreover, 100% of oligodendrocytes exposed to 2Phatal die, while damaged but surviving oligodendrocytes are likely to be the cells that participate in remyelination28,52. Future experiments investigating whether titration of 2Phatal can result in cellular DNA damage without cell death could provide a means to test this question.
Distinct OPC populations are thought to exist regionally and temporally15,53 however little is known about functional heterogeneity within brain microregions. We observed highly branched, GPR17-negative cells adjacent to GPR17-expressing cells with simpler morphology and this morphological signature was linked to fate. This suggests that functional heterogeneity can exist in a spatially confined region of the mammalian brain and is consistent with past findings on GPR17 modulating oligodendrocyte development and response to injury 54-57. Importantly, the relationship between morphology and fate was absent in control regions, suggesting a damage associated emergence of these OPCs. This is consistent with extensive literature showing hypertrophic OPCs in various pathologies however previous studies could not determine their fate.
Morphological complexity was predictive of cell fate weeks after analysis, thus it is unlikely that our observations were due to transient morphological changes during differentiation or death. Moreover, the most complex cells did not express BCAS1 or TCF7L2, markers of premyelinating oligodendrocytes. Consistent with our findings, a recent report linked OPC morphology with function in zebrafish17. Whether our observations represent differences in cellular microenvironment at the early stages of myelin damage, signaling between neurons and subsets of OPCs, or local genetic diversity within the OPC population remains unclear.
Lastly, myelin degeneration and failed OPC differentiation occurs in aging, likely contributing to cognitive decline41,58-60. While the features of age-related myelin loss have been extensively documented, the cellular dynamics, molecular mechanisms involved, and its functional impacts on the CNS remain largely unanswered3,5,58. Our analysis of myelin degeneration, in the context of 2Phatal, cuprizone, and aging, revealed similarities in both the spatiotemporal dynamics and pathology across these conditions. Oxidative stress and DNA damage are thought to play a role in oligodendrocyte death in aging2,3,58,61. Taken together, the drawn-out mechanism of 2Phatal-induced oligodendrocyte degeneration likely represents a conserved, intrinsic response to oxidative damage by oligodendrocytes. This makes 2Phatal a powerful method for investigating the cellular and molecular mechanisms underlying oligodendrocyte death.
METHODS
Animals
All procedures were approved by the institutional animal care and use committee (IACUC) at Dartmouth College. The following mouse strains were purchased from Jackson labs and crossed to generate the double and triple transgenic mice used in this study: Cnp-mEGFP33 (JAX #026105), Cspg4-creER62 (JAX #008538), Cx3cr1-creER63 (JAX #020940), floxed tdTomato Ai1464 (JAX #007914). All mouse strains used have C57bL/6 background. Mice were housed in a 12/12 light/dark cycle in a temperature (22 degrees C) and humidity-controlled (30-70% relative humidity) animal vivarium with food and water provided ad libitum. For all experiments (except aging and multifocal 2Phatal) mice were 6-8 weeks old at the start of the experiments with control mice being aged matched. For multifocal 2Phatal experiments, we used two male and two female mice 7 months of age at the start of the experiment. Aged mice were defined as 22-24 months old. Both male and female mice were used in this study.
Surgical procedures
All in vivo imaging was done using chronic cranial window preparations. In short, animals were anesthetized by intraperitoneal injection of ketamine (100 mg/kg) and xylazine (10 mg/kg). The skin covering the skull was shaved and sterilized before removal. A high-speed drill was used to perform a 3-4 mm craniotomy and the skull was replaced by a #0 cover glass. For 2Phatal experiments, Hoechst 33342 nuclear dye (ThermoFisher #H3570) was topically applied to the pial surface, before placing the cover glass. A nut was attached to the skull with cyanoacrylate glue and embedded in dental cement to enable repeated animal immobilization for imaging. Mice were given carprofen (50 mg/kg), subcutaneously, following the surgery and at 24- and 48-hours.
2Phatal
For targeted two-photon apoptotic targeted ablations (2Phatal), cranial windows were performed as described above. Hoechst 33342 was topically applied (0.1 mg ml−1 diluted in PBS) to the pial surface for 5 minutes before the cover glass was secured. Control mice received identical dye applications without subsequent 2Phatal. Mice were allowed to recover for 24 hours to ensure proper nuclear labeling. Each position was imaged sequentially on a two-photon microscope using 775nm, 920nm and 1040nm laser wavelengths and the channels were overlayed, to identify mature oligodendrocyte nuclei. To induce 2Phatal, a single ROI (8x8 μm2) was drawn around the identified nucleus. The laser wavelength was set at 775nm, with a dwell time of 100 μs. For each ablation, we employed the same time-series parameters of 125 scans, lasting in total 3.72 seconds. Following 2Phatal, each location was imaged again using 775nm and 920nm to visualize photobleaching and ensure no membrane disruption or laser thermal damage was caused during each photobleaching event. To quantify photobleaching, the average fluorescence intensity was calculated for each time point. These values were then normalized to the average intensity of the first scan to get a percent change in fluorescence intensity over time. For 2Phatal experiments, we targeted between 4 and 9 oligodendrocytes per imaging position. This range was due to differences in mature oligodendrocyte density and slight variations in Hoechst 33342 labeling. Young 2Phatal experiments were performed on 6–8-week-old, female mice, with age matched controls.
For multifocal oligodendrocyte 2Phatal experiments, a tiled image of the entire window (~2mm x 2mm) was captured immediately prior to 2Phatal. This image was used as a reference to identify all possible positions where 2Phatal could be performed. In total, 860 cells were targeted between 4 mice, ranging from 116 to 291 cells per mouse. 2Phatal of each cell was performed as before. Following 2Phatal mice were allowed to recover for 28 days post 2Phatal. A final tiled image was captured at day 28 before animal perfusion and tissue processing.
Immunohistochemistry
Mice were perfused with a 4% PFA/PBS solution prior to brain dissection. The tissue was post-fixed in the same solution overnight, at 4°C. We prepared 75 μm coronal sections using a vibratome and stored the slices in PBS containing 0.01% sodium azide at 4°C. For immunostaining, slices were permeabilized in 0.5% triton-X100 in PBS for 30 minutes. The tissue was transferred to blocking solution for 30 minutes at room temperature. Blocking solution was either 5% goat serum (Sigma, Cat#G9023) in PBS or 1% bovine serum albumin (BSA), depending on primary antibody host species. Primary antibody incubation was performed at 4°C in 0.1% triton-X100 and 1% BSA in PBS, overnight. Sections were washed three times for 15 minutes in PBS. Secondary staining was done at room temperature for one hour in 0.1% triton-X100 and 1% BSA in PBS. Sections were then washed again three times for 15 minutes and mounted using DAPI Fluoromount-G (Southern Biotech, Cat#0100-20). When required, antigen retrieval was performed, prior to permeabilization, at 98°C for 3 minutes in pre-heated 10mM TRIS, 1mM EDTA, 0.05% TWEEN buffer in PBS, at pH 9. Primary antibodies used in this study include: Chicken anti-RFP (Rockland, 1:250, Cat#600-901-379, antigen retrieval required), Guinea pig anti-CNPase (Synaptic Systems, 1:500, Cat#355004, antigen retrieval required), Goat anti-Olig2 (R&D, 1:100, Cat#AF2418), Rabbit anti-Bcas1 (Synaptic Systems, 1:1000, Cat#445003), and Rabbit anti-GPR17 (Provided by Maria Abbracchio and Davide Lecca, 1:10,000, antigen retrieval, TSA)65,66. The following secondaries were used in this study: alexa fluor 488 goat anti-guinea pig (Thermofisher Cat# A-11073), alexa fluor 488 donkey anti-goat (Thermofisher Cat# A-11055), alexa fluor 555 goat anti- chicken (Thermofisher Cat# A-21437), alexa fluor 647 donkey anti-rabbit (Jackson ImmunoResearch Cat# 711-605-152), alexa fluor 647 goat anti-rabbit (Thermofisher Cat# A-21244), HRP goat anti-rabbit (Thermofisher Cat# 31466). All secondaries were diluted 1:500 in blocking solution. Immunostaining for CNP and RFP were necessary as antigen retrieval was required for several primary antibodies and this process quenched endogenous fluorescence.
Tyramide Signal Amplification
Tyramide signal amplification (TSA) (Biotium, Cat#33013) was performed with all GPR17 immunostaining. In brief, brain tissue was prepared for staining as before. Slices were incubated in 1% hydrogen peroxide for 20 minutes to quench endogenous peroxidase activity prior to being placed in blocking buffer. Following primary antibody incubation and wash steps, slices were incubated with a horseradish peroxidase conjugated secondary antibody for 30 minutes at room temperature. Sections were washed three times for 10 minutes in PBS. Amplification buffer was prepared per Biotium’s provided protocol. Sections were incubated in fluor (1:500) amplification buffer for 10 minutes and then immediately washed in PBS 3 times. Additional staining for CNPase and RFP was done after this TSA staining.
Cuprizone demyelination
Cranial window preparations were performed on Cnp-mEGFP mice before a recovery period of 3 weeks. Following this, baseline, day 0, images were taken, and the mice were placed on a 0.2% (w/w) cuprizone (Sigma Aldrich #C9012) diet mixed with ground chow for 6 weeks. Fresh food was provided every 2-3 days. After 6 weeks of treatment, mice were placed back on normal, control, powdered chow for 4 weeks. Combined fluorescence and SCoRe in vivo imaging were conducted weekly using an upright laser scanning confocal microscope (Leica SP8) with a 20x water immersion objective (Leica NA 1.0).
Imaging
All fluorescence in vivo imaging was performed using an upright laser scanning confocal microscope (Leica SP8 with LasX software version 3.5.7) with a 20x water immersion objective (Leica NA 1.0) or a two-photon microscope (Bruker with Prairie Software version 5.4) equipped with an Insight X3 femtosecond pulsed laser (Spectra Physics) and a 20x water immersion objective (Zeiss NA 1.0). Spectral confocal reflectance (SCoRe) microscopy was done using the upright laser scanning confocal microscope. The reflection signal was captured from 448nm, 488nm, 552nm, and 637nm lasers and overlayed to identify compact myelin. For confocal fluorescence microscopy, 488nm was used to excite mEGFP and 552nm was used to excite tdTomato. Fluorescence and SCoRe images were acquired sequentially. For two-photon fluorescence microscopy, 775nm was used to excite Hoechst nuclear dye, 920nm was used to excite mEGFP, and 1040nm was used to excite tdTomato. Z-stacks were taken with a step size of 1.5μm. Mice were imaged as described in the text and figures. Fixed tissue imaging was performed on an upright laser scanning confocal microscope (Leica SP8), using either a 20x air objective (Leica NA 0.75) or a 63x oil immersion objective (Leica NA 1.4). Images containing multiple fluorophores were captured sequentially, by stack, with the smallest wavelength fluorophore being captured last.
Microglia response to 2Phatal
To investigate the acute response of microglia to 2Phatal photobleaching, targeted and control non-targeted adjacent oligodendrocytes were selected. Cropped max projection images were analyzed and the fluorescence intensity was measured of the microglia signal in a 50 μm radius region of interest centered on the targeted or control oligodendrocyte before 20 minutes and 1 day after photobleaching as previously described31. Changes in microglia fluorescence were calculated and compared between the control non-bleached and 2Phatal cells using one-way ANOVA with Sidak’s multiple comparisons correction.
OPC fate
To quantify OPC fate in CNP-mEGFP:Cspg4-creER:tdTomato mice, z-stack, time series HyperStacks were created for days 28-60 after 2Phatal or in similarly aged control mice that did not have any oligodendrocytes targeted with 2Phatal. Z projection images were created and registered, and cell behavior and the fate were analyzed for each cell with OPC morphology. Potential fates noted were 1) remained OPC 2) cell death and 3) oligodendrocyte differentiation as evidenced by expression of CNP-mEGFP. Cell division events were also noted for all analyzed cells. Lineage diagrams were constructed for each cell (examples in Fig. 3) and differences in the fate of OPCs in control mice and mice that had oligodendrocytes targeted via 2Phatal were determined using unpaired t-tests as indicated in the text and figures. For analysis of OPC fate adjacent to or away from dying oligodendrocytes, a region of interest (ROI), 150 μm in diameter, was drawn around targeted oligodendrocyte cell soma. OPCs were classified as away from or adjacent to targeted cells if they were outside or inside of these ROIs on day 28 after 2Phatal.
OPC migration
For analyses of OPC migration in control and 2Phatal conditions, images were aligned for the whole time series of day 28 to day 60 and made into a HyperStack. The image stack was then opened in Fiji using the TrackMate plugin (version 7.6.1). Calibration settings were then inputted to convert pixels to microns. The LoG detector was selected and an estimated blob diameter of 13 μm was used for the cell body and the sub pixel localization was turned off. Once TrackMate detected the “blobs” in the image stack, an automatic threshold was applied. The detected blobs are overlayed onto the image using the HyperStack displayer. The Simple LAP Tracker was then selected to track the movement of the cells throughout the time series. Initially the Linking Max distance was set to 15 μm, Gap-closing max distance was set to 15 μm, and the Gap-closing max frame gap was set to 2. The tracks will then be overlayed onto the HyperStack displayer. If breaks in the track for individual cells were detected after visual inspection the parameters in the Simple LAP Tracker were adjusted. After all the tracks were confirmed to follow the movement of the cell, TrackMate was used to determine the total distance traveled for each cell. These values were then compiled and analyzed in relation to condition and cell fate.
OPC morphology
Sholl analyses were conducted on max projection cropped images using a previously developed Fiji plugin (version 4.0.13)67. Before analysis all images were converted to an 8-bit format with a gray overlay, smoothed, and auto threshold. A straight line was drawn from the center of the cell to the outer most part of the image. The starting radius was set to 2 μm and the end radius was set to 100 μm. 2 μm increments were used for analysis. In some cases, single cells were traced using the simple neurite tracer plugin in Fiji (version 4.0.13).
Oligodendrocyte death and myelin sheath dynamics
To facilitate analysis, time series of each position were combined into HyperStacks using Fiji. For the quantification of survival curves in the 2Phatal and cuprizone models (Fig. 1), cell death was defined as the first time point in which there was no longer evidence of the cell soma as seen by mEGFP fluorescence. To quantify the survival curve and average time to cell death for 2Phatal, every targeted cell was tracked from day 0 to degeneration of the cell soma. For cuprizone, every oligodendrocyte in the field of few on day 0 was counted and evaluated at subsequent time points for degeneration. However, only cells that died over the course of the experiment were used to calculate average time to cell death. For the quantification of changes in oligodendrocyte soma area (Fig. 1), ROIs were drawn around each cell in Fiji, using the Selection Brush Tool, and used to calculate soma area at timepoints 1-3 days apart. In cases where the soma was in focus across multiple z slices, the slice with the largest area was used. Cells were excluded from soma area analysis if there were timepoints where the local image quality of individual cells was insufficient to acquire an accurate area measurement. Oligodendrocyte soma area in aged animals (Fig. 7) were obtained using the same method obtained from images taken at the start of the experiment. Mice used for the P500 time point were aged P512, P536, and P578. Mice used for the P700 time point were aged P724, P738, and P738. P500 and P700 labels were used for simplicity.
For the quantification of sheath loss of individual oligodendrocytes (Fig. 2), the proximal processes of targeted oligodendrocytes were traced from the cell soma to the adjoining internodes. Sheaths were excluded if there was any doubt as to the cell of origin. As with cell death, each sheath was marked as degenerated on the first timepoint with no evidence of the sheath seen by mEGFP fluorescence. For the quantification of changes in sheath length and SCoRe:GFP ratio of degenerating cells (Fig. 2), a subset of the previously identified sheaths was analyzed. The Segmented Line Tool was used in Fiji to trace each sheath. For SCoRe measurements, each reflection wavelength was combined into a single channel, used to calculate lengths by summing the segments of compact myelin. Breaks in SCoRe signal, ≥1.5μm, were defined as sections of uncompact myelin which were not added to the SCoRe length sum of each sheath. SCoRe:GFP ratio was calculated by dividing the sum of SCoRe measurements by the measured length of each sheath (mEGFP channel). In depth quantification of remyelination (Fig. 6) was done in the same manner.
For the quantification of degeneration and remyelination across each position (Fig. 5), mEGFP+/tdTomato− sheaths were blindly selected from the first time point, independent of the cell of origin, and evaluated on day 60 for stability (mEGFP+/tdTomato−), remyelination (mEGFP+/tdTomato+) or degeneration without repair (not remyelinated). For the quantification of node stability (Extended Data Fig. 8), nodes of Ranvier were blindly selected (both hemi nodes were mEGFP+/tdTomato−), independent of the cells of origin, and evaluated on day 60 as before.
For the quantification of remyelination efficiency and time to remyelination, sheaths, originating from targeted cells, were tracked over the time series to determine when degeneration took place and when/if they were remyelinated (Fig. 5). Patterning was determined on the first time point, based on the presence of adjacent internodes. To quantify time to remyelination, we calculated the time between disappearance of each sheath and initiation of repair, using mEGFP and tdTomato fluorescence. To quantify the prevalence of each identified method of remyelination (compaction and GFP lost; compaction lost, GFP maintained; compaction and GFP maintained), we tracked each sheath through every time point (identified above) and documented mEGFP and SCoRe loss during remyelination.
For the quantification of sheath pathology and degeneration in aged mice (Fig. 7, Fig. 8), the increased density of myelin made it impractical to assign individual myelin sheaths consistently and accurately to their originating oligodendrocyte by tracing proximal processes. Instead, a 50 μm diameter circle was drawn centered around each oligodendrocyte. Sheaths were chosen that intersected this circle within a volume 7.5 μm above or below each cell. The state of each sheath was evaluated at timepoints 10 days apart. Myelin balloons were defined as circular swellings within a sheath which lacked fluorescence signal in the center. For images where SCoRe was captured, a punctate signal at the center of the balloon (Fig. 7) further confirmed the pathology. Sheath swellings were defined as regions within the sheath that were larger than adjacent portions of the sheath but were distinguished from balloons by the presence of fluorescence signal throughout the structure. Similarly, for images where SCoRe was captured, swellings lacked a centered punctate seen in balloons. Sheath retraction was defined as a change in extension of a paranode greater than 5 μm. This was measured using myelin sheaths that intersected the sheath of interest as a reference point.
Oligodendrocyte and myelin sheath density in young and aged animals.
Oligodendrocyte density was determined by counting the total number of oligodendrocyte soma in at least 2 separate images from 4 young mice and 3 aged mice at two time points 60 days apart. Image dimensions were used to calculate the density of oligodendrocytes in each animal in cells / mm3. For measurements of myelin sheath density in young and aged control and 2Phatal targeted cells 100 μm x 100 μm images centered on a single oligodendrocyte soma were created and mean fluorescence intensity measurements were recorded from auto-thresholded images.
Statistics and Reproducibility
All statistical analyses were performed in Graphpad Prism software. No statistical methods were used to predetermine sample sizes, but our sample sizes are similar to those reported in previous publications28-30. Animals were randomly assigned to 2Phatal and control groups. Experimenter blinding was used for data acquisition and for Sholl analysis and quantification of cell densities and identities on control vs 2Phatal sides. Experimenters were also blinded to OPC fate relative to oligodendrocyte soma location and morphological complexity and these analyses were also conducted by separate individuals. For the remaining experiments, knowledge of the experimental group did not influence the outcome of the experiment because the analyses were automated. Data distribution was assumed to be normal for all experiments, but this was not formally tested. No animals or data points were excluded from the analyses.
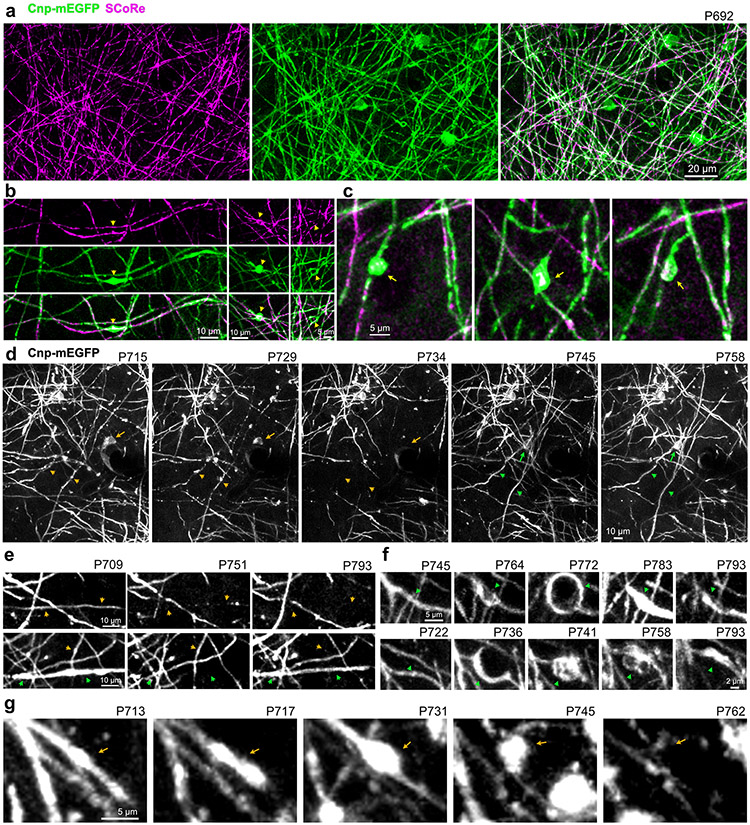
Images shown in the figures are examples of experiments repeated: Fig. 1a (15 times), Fig. 2a (15 times), Fig. 2c (4 times), Fig. 2f (11 times), Fig. 2g (7 times), Fig. 2h (4 times), Fig. 2j (11 times), Fig. 3d (8 times), Fig. 3i (8 times), Fig. 4a (8 times), Fig. 4e (4 times), Fig. 4f (4 times), Fig. 5a (4 times), Fig. 6d (4 times), Fig. 7a (3 times), Fig. 7b (3 times), Fig. 7e (3 times), Fig. 8a (3 times), Fig. 8e (3 times), Extended Data Fig. 1a (3 times), Extended Data Fig. 1b (3 times – control; 3 times – 2Phatal), Extended data Fig. 1d (3 times), Extended Data Fig. 1e (3 times), Extended Data Fig. 4a (8 times), Extended Data Fig. 4g (4 times), Extended Data Fig. 5a (4 times), Extended Data Fig. 6a (4 times), Extended Data Fig. 6b(4 times), Extended Data Fig. 6c (4 times), Extended Data Fig. 6e (4 times), Extended Data Fig. 10a (3 times), Extended Data Fig. 10b (3 times), Extended Data Fig. 10c (3 times), Extended Data Fig. 10d (3 times), Extended Data Fig. 10e (3 times), Extended Data Fig. 10f (3 times), Extended Data Fig. 10g (3 times).
Extended Data
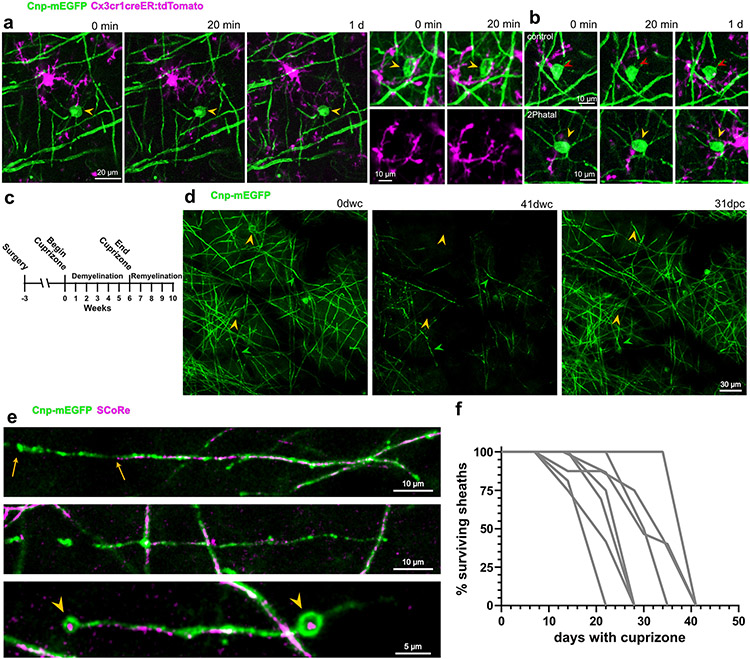
Extended Data Fig. 1 ∣. Microglia do not acutely respond to oligodendrocyte 2Phatal and cuprizone-induced myelin pathology and dynamics of degeneration.
(a) In vivo images from dual-reporter, triple transgenic mice with oligodendrocytes (green) and microglia (magenta) labeling. Microglia exhibited no immediate chemotactic response towards oligodendrocytes targeted with 2Patal (orange arrowheads) demonstrating no disruption of the targeted oligodendrocyte cell membrane during 2Phatal photobleaching. (b) Additional examples of control (red arrowheads) or 2Phatal (yellow arrowheads) oligodendrocyte soma again showing no chemotactic response by the microglia up to 1 day later. These examples were selected to show that while occasionally there were microglial cell processes and thus fluorescent signals detected in the quantification adjacent to the soma 1 day later, there is not a phagocytic response. (c) Paradigm used for cuprizone induced demyelination experiments. Mice were fed 0.2% w/w cuprizone mixed in ground chow. In-vivo imaging was done weekly, starting at week 0, through week 10. (d) Cuprizone induced widespread demyelination and oligodendrocyte cell loss (orange arrowheads) after 41 dwc (days with cuprizone). Remyelination was largely complete by 31 dpc (days post cuprizone). Green arrowheads denote points of reference for position orientation. (e) Representative images of common myelin pathology observed during cuprizone intoxication, including partial loss of compaction (top, between arrows), visualized by a lack of SCoRe signal, complete loss of compaction with myelin debris (middle), and balloon formation (bottom, arrowheads). (f) Temporal dynamics of sheath degeneration during cuprizone intoxication. Each trace represents sheaths produced from a single oligodendrocyte (n = 8 cells, 116 sheaths, 3 mice).
Extended Data Fig. 2 ∣. The Cnp-mEGFP:Cspg4-creER:tdTomato mouse line identifies newly generated oligodendrocytes.
(a) Example in-vivo image showing a previously generated, tdTomato−, oligodendrocyte (orange arrow) and tdTomato+ OPCs (white arrows) at day 0. (b) Time series showing the differentiation of new dual-labeled oligodendrocytes (yellow arrows) over the course of the experiment, while a previously established single labeled oligodendrocyte (orange arrow) is maintained. (c) Representative image of a Cnp-mEGFP:Cspg4-creER:tdTomato mouse at day 60 showing all surviving oligodendrocytes (arrows) are dual labeled with mEGFP+ and tdTomato+. For this example all cells at day 0 that were mEGFP+ were targeted with 2Phatal (d) Time series showing the presence of a new mEGFP+/tdTomato+ oligodendrocyte (orange arrow, top images) at day 60. During all experiments we encountered only a single tdTomato− oligodendrocyte, that was generated between day 0 and day 60 (white arrow, bottom images). (e) Of the 107 remyelinating sheaths analyzed, a single sheath was tdTomato−. As it was in the vicinity of the tdTomato− cell shown in d, it is likely to have originated from that cell.
Extended Data Fig. 3 ∣. Increased oligodendrocyte generation compensates for cell degeneration.
(a) Cell maps of imaging positions in control animals, denoting the locations of oligodendrocytes present at the start of imaging (non-targeted oligodendrocytes, black dots) and oligodendrocytes produced over 60 days (new oligodendrocytes, cyan dots) (scale bars are 50μm). (b) Cell maps of imaging positions in animals targeted with 2Phatal on day 0, denoting the locations of oligodendrocytes targeted with 2Phatal (red dots), non-targeted oligodendrocytes present at day 0 (black dots), and new oligodendrocytes produced over 60 days post 2Phatal (cyan dots) (scale bars are 50μm). (c) Average number of new oligodendrocytes generated per day, over 60 days, in mice not targeted with 2Phatal (control, n = 4 mice) and mice with oligodendrocytes targeted with 2Phatal (blue, n = 4 mice). There were significantly more oligodendrocytes produced per day in mice targeted with 2Phatal than in control animals (two-tailed, unpaired t test, error bars are SEM). (d) Average fold-change in total oligodendrocytes in each position, between day 0 and day 60, in mice without oligodendrocyte 2Phatal (control, n = 4 mice) and mice with oligodendrocyte 2Phatal (2Phatal, n = 4 mice). (two-tailed, Unpaired t test, error bars are SEM).
Extended Data Fig. 4 ∣. Local OPC migration is unaffected by oligodendrocyte 2Phatal and OPC morphological complexity during remyelination.
(a) Representative MAX projection of a single time point, showing OPCs (magenta), used to determine the migration of OPCs over time. (b) Example OPC migration tracks between day 28 and day 60 from a single imaging location. Each line represents the migration track of a single cell. (c) The total distance traveled (left) and net displacement (right) of OPCs in control mice compared to mice targeted with 2Phatal. There was no significant difference in overall migration behavior between the two groups (control n = 48 cells, 2Phatal n = 45 cells, two-tailed, unpaired t test, dots indicate single cells, error bars are SEM). (d) Sholl analyses of two representative OPCs with the total number of cell process intersections plotted relative to the cell center. (e) Images showing the morphology of the five most complex OPCs (top row) and five least complex OPCs (bottom row) paired with the fate of each of those cells. (f) Linear regression analyses revealed no correlation between total intersections and the time from Sholl analysis to final fate outcome in control (left), days post analysis refers to the time of fate determination relative to the day of Sholl analysis (day 28 after 2Phatal) (n = 12 differentiating cells, blue, and n = 14 dying cells, green) and 2Phatal (right) conditions (n = 34 differentiating, blue, and n = 21 dying, green). (g) Single OPCs imaged over 23 days showing relatively stable morphological complexity. (h) The total of intersections captured from multiple Sholl analysis and the same cell over time, again showing relatively stable morphological complexity over weeks.
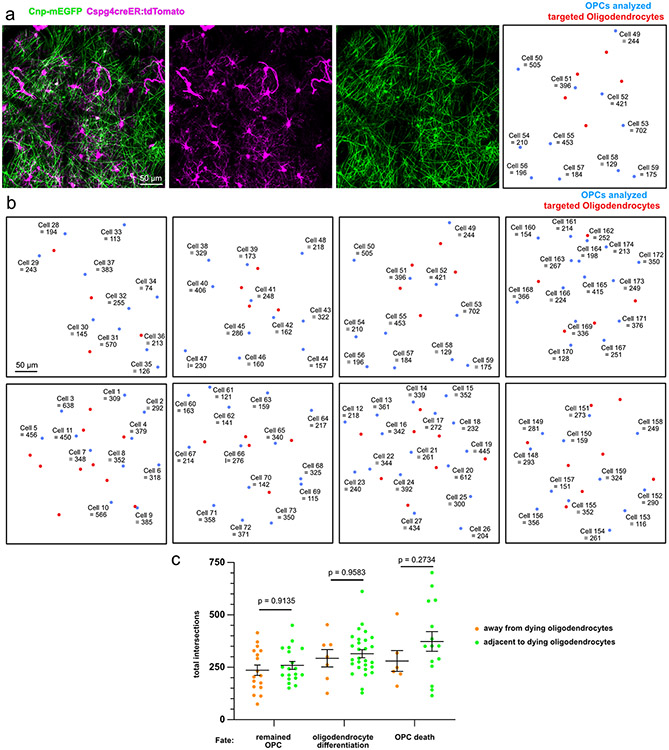
Extended Data Fig. 5 ∣. Localization maps of OPC morphological complexity.
(a) Single position captured at day 28 after oligodendrocyte 2Phatal showing OPCs, oligodendrocytes and a corresponding cell map of the targeted oligodendrocytes (red dots) and OPCs (blue dots). Numbers indicate the cell ID and total intersections for that cell. (b) Additional cell maps of all positions used in the 2Phatal conditions showing OPC location and morphological complexity (cell ID + total intersections for that cell) and locations of targeted oligodendrocytes (red dots) (c) The total intersections of all cells that remained OPCs, differentiated, or died either adjacent to or away from targeted oligodendrocytes. Remained OPC n = 19 adjacent, 17 away, oligodendrocyte differentiation n = 28 adjacent, 7 away; OPC death n = 15 adjacent, 6 away. One way ANOVA with Sidak’s multiple comparison’s test, error bars are SEM.
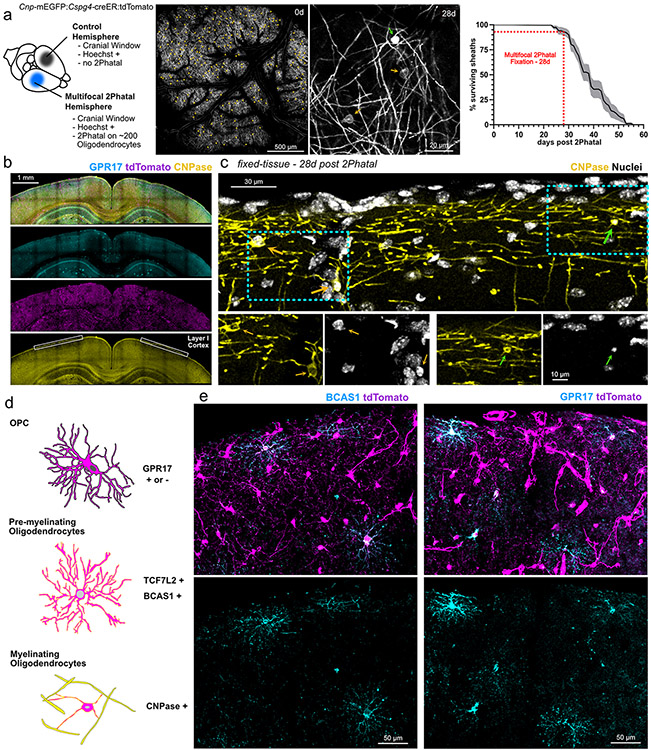
Extended Data Fig. 6 ∣. Multifocal 2Phatal enables molecular interrogation of OPCs during oligodendrocyte death.
(a) Pipeline demonstrating our approach to multifocal 2Phatal. Oligodendrocytes (orange arrowheads) throughout the cranial window were targeted with 2Phatal. 28 days post 2Phatal, targeted cells (green arrow) can be easily identified by their bright, condensed somas compared to non-targeted cells (orange arrows). Animals used in multifocal experiments were perfused at day 28 which is prior to the majority demyelination (n = 19 cells, 183 sheaths, 4 mice, error is SEM). (b) Brain sections can then be immunolabeled. Analysis was localized to layer I cortex (box), as this was where 2Phatal was performed. (c) 2Phatal-targeted oligodendrocytes (green arrows) can be easily identified in fixed tissue by their condensed soma compared to non-targeted oligodendrocytes (orange arrows). Nuclear condensation was also a reliable method for identification. (d) Schematic identifying genes of interest for our pipeline. GPR17 is known to label subpopulations of OPCs. TCF7L2 and BCAS1 were used as markers to identify active differentiation. CNP was used as a marker to exclude oligodendrocytes from our analysis. (e) Representative images of immunostaining for BCAS1 (left) and GPR17 (right).
Extended Data Fig. 7 ∣. Identity and density of OPCs following multifocal 2Phatal.
(a) Representative images of BCAS1 staining following multifocal 2Phatal and quantification of BCAS1 positive CNP negative cell density in layer I cortex (n = 4 animals, two-tailed, unpaired t-test, error bars are SEM). Sholl was performed on tdTomato labeled BCAS1 positive CNP negative cells (left), BCAS1 positive cells with CNP co-labeling and/or attached sheaths (right) were excluded. (b) Representative image of TCF7L2 and OLIG2 staining following multifocal 2Phatal. Density of TCF7L2 cells is also reported (n = 4 animals, two-tailed, unpaired t-test, error bars are SEM). (c) Representative image showing GPR17 staining following multifocal 2Phatal. GPR17 subcellular localization to the membrane (left arrow) and cytosol (middle arrow) can be visualized, as well as no expression (right arrow). Density of combined GPR17 negative, CNP negative cells is reported (n = 4 mice, two-tailed, unpaired t-test, error bars are SEM). Grouped data showing the total intersections of GPR17+ cells with membrane (cyan) or cytosolic (orange) localization in control and 2Phatal conditions (Membrane n = 21 cells, cytosolic n = 32 cells, 4 animals, one-way ANOVA with Tukey correction for multiple comparisons, error bars are SEM)
Extended Data Fig. 8 ∣. Initial node of Ranvier locations are reestablished after remyelination.
(a) In vivo images of a node of Ranvier present at day 0 between mEGFP only labeled sheaths, which reformed at its original location between two mEGFP and tdTomato double labeled sheaths, as seen at day 60. (b) Nodes from 2Phatal mice were randomly selected on day 0, blind to the cell of origin, and evaluated on day 60, to determine if they were stable (mEGFP+ only) were reformed through remyelination (mEGFP+tdTomato+) or degenerated (80 nodes from n = 4 mice) (c) Proportion of nodes that were displaced between days 0 and 60 for both nodes that remained stable (n = 31) and nodes that were regenerated following remyelination (n = 41). All error bars are SEM.
Extended Data Fig. 9 ∣. Synchronous remyelination facilitates rapid remyelination in vivo and spatiotemporal maps of asynchronous and synchronous remyelination.
(a) Original images used to generate the traced time series shown in Fig. 6. The initiation of remyelination is evident by emergence of tdTomato signal (arrowheads) on day 31. (b) Additional example of synchronous remyelination without score loss throughout the repair process. (c) Representative imaging positions in CNP-mEGFP mice with oligodendrocytes targeted with 2Phatal (left), highlighting sheaths produced by targeted oligodendrocytes (middle, cyan). The same sheaths are then presented based on eventual fate post-2Phatal (right), including sheaths that were never repaired (lost, black), fully degenerated and then repaired (SCoRe and mEGFP lost, grey), underwent synchronous remyelination with loss of score (SCoRe lost mEGFP maintained, magenta), and underwent synchronous remyelination without losing SCoRe (SCoRe and mEGFP maintained, red). Targeted oligodendrocytes are shown as black dots (right).
Extended Data Fig. 10 ∣. Myelin pathology and dynamics of degeneration in aged mice.
(a) In-vivo image of myelin, in layer I of the somatosensory cortex, in an aged mouse, acquired using SCoRe and fluorescence microscopy. (b) Aged mice displayed widespread myelin pathology (arrowheads) including myelin swellings (left), debris accumulation (middle), and balloons (right). (c) Additional examples of myelin swellings (arrows) in aged animals. (d) Oligodendrocyte death (yellow arrows) and myelin degeneration (yellow arrowheads) followed by the emergence of a newly generated oligodendrocyte (green arrows) and remyelinating sheaths (green arrowheads). This was the only example of remyelination due to the differentiation of a new oligodendrocyte we observed in aged animals. (e) Representative time series showing failed remyelination following myelin degeneration (orange arrowheads) and successful remyelination after sheath loss (green arrowheads). (f) Sheath repair was observed to occur following balloon formation (green arrowheads). (g) Severe myelin pathology, seen in aged mice, often resulted in full sheath degeneration (bottom, orange arrowheads)
Supplementary Material
Supplementary Video 1: Oligodendrocyte degeneration following 2Phatal
In-vivo time series showing the degeneration of a mEGFP labeled oligodendrocyte following 2Phatal. The dashed line represents the soma diameter before 2Phatal. Soma condensation occurs within the first 14 days, while final cell death does not occur until 49 days following photobleaching. Images were acquired in layer I of the somatosensory cortex. (Frame rate: 2 frames per second)
Supplementary Video 2: OPC division
In-vivo time series in a Cnp-mEGFP:Cspg4-creER:tdTomato mouse showing OPC (magenta) division events. Arrows denote OPC that undergo division. Images were acquired in layer I of the somatosensory cortex. (Frame rate: 2 frames per second)
Supplementary Video 3: OPC apoptosis
In-vivo time series in a Cnp-mEGFP:Cspg4-creER:tdTomato mouse showing OPC (magenta) apoptosis. Note the appearance of apoptotic bodies on day 62, which are cleared by day 64. Images were acquired in layer I of the somatosensory cortex. (Frame rate: 2 frames per second)
Supplementary Video 4: Generation of oligodendrocytes from OPCs
In-vivo time series in a Cnp-mEGFP:Cspg4-creER:tdTomato mouse showing the differentiation of an OPC (magenta) into a myelinating oligodendrocyte. Following differentiation, the soma contracts and becomes stationary. Newly formed myelin is evident as it is dual labeled with mEGFP (green) and tdTomato (magenta). (Frame rate: 2 frames per second)
Supplementary Video 5: Long term in-vivo imaging of OPCs and oligodendrocytes
In-vivo time series in a Cnp-mEGFP:Cspg4-creER:tdTomato control mouse, not targeted with 2Phatal, demonstrating the behavior of oligodendrocytes (green) and OPCs in layer I of the somatosensory cortex. As new oligodendrocytes are generated, myelin density increases. Dates represent days postnatal (postnatal 62 – postnatal 102). (Frame rate: 2 frames per second)
Supplementary Video 6: Dynamics of oligodendrocyte degeneration, OPC fate, and rapid remyelination following oligodendrocyte 2Phatal
In-vivo time series showing the degeneration of an oligodendrocyte (green) targeted with 2Phatal and local OPC (magenta) behavior. Oligodendrocyte degeneration (orange arrowhead) occurs over 40 days, characterized by rapid soma condensation. Throughout and following the degeneration, neighboring OPCs respond to the death via differentiation and remyelination.
Supplementary Video 7: Remyelination following myelin sheath degeneration
Expanded time series of the sheath degeneration and repair sequence used in Fig. 5, including SCoRe microscopy (yellow). Remyelination is clearly visible due to the presence of tdTomato fluorescence (magenta) in the newly forming sheath. Note that cytoplasmic tdTomato fluorescence intensity is highest when the remyelinating sheath is first formed (day 44) and not yet compact, as evident by the lack of SCoRe signal. (Frame rate: 2 frames per second)
ACKNOWLEDGEMENTS
This work was supported by the following grants from the National Institutes of Health: R00NS099469, P20GM113132, R01NS122800 and by a New Vision Award through the Donors Cure Foundation, a Fay/Frank Seed Grant from the Brain Research Foundation, and funding from the Esther A. & Joseph Klingenstein Fund and Simons Foundation to R.A.H. G.E.O was supported by a GAANN department of education grant (# P200A210064). We thank Davide Lecca and Maria Abbracchio (Università degli Studi di Milano) for graciously sharing the antibody to GPR17, Dartmouth colleagues Leeza Petrov and Sophia Gregorace for contributions to data analysis. We thank members of the Hoppa Lab at Dartmouth for critical feedback throughout the project.
Footnotes
COMPETING INTERESTS
The authors declare no competing interests.
DATA AVAILABILITY
All data used for quantification and statistical comparisons are provided in the source data file associated with each figure. All imaging data files are available on an unrestricted basis from the corresponding author.
REFERENCES
- 1.Zalc B, Goujet D & Colman D The origin of the myelination program in vertebrates. Curr. Biol 18, R511–2 (2008). [DOI] [PubMed] [Google Scholar]
- 2.Stadelmann C, Timmler S, Barrantes-Freer A & Simons M Myelin in the Central Nervous System: Structure, Function, and Pathology. Physiol. Rev 99, 1381–1431 (2019). [DOI] [PubMed] [Google Scholar]
- 3.Franklin RJM & Ffrench-Constant C Remyelination in the CNS: from biology to therapy. Nat. Rev. Neurosci 9, 839–855 (2008). [DOI] [PubMed] [Google Scholar]
- 4.Nave K-A Myelination and support of axonal integrity by glia. Nature 468, 244–252 (2010). [DOI] [PubMed] [Google Scholar]
- 5.Peters A & Kemper T A review of the structural alterations in the cerebral hemispheres of the aging rhesus monkey. Neurobiol. Aging 33, 2357–2372 (2012). [DOI] [PMC free article] [PubMed] [Google Scholar]
- 6.Almeida RG & Lyons DA On myelinated axon plasticity and neuronal circuit formation and function. J. Neurosci 37, 10023–10034 (2017). [DOI] [PMC free article] [PubMed] [Google Scholar]
- 7.Fields RD A new mechanism of nervous system plasticity: activity-dependent myelination. Nat. Rev. Neurosci 16, 756–767 (2015). [DOI] [PMC free article] [PubMed] [Google Scholar]
- 8.Chapman TW & Hill RA Myelin plasticity in adulthood and aging. Neurosci. Lett 715, 134645 (2020). [DOI] [PMC free article] [PubMed] [Google Scholar]
- 9.Nishiyama A Polydendrocytes: NG2 cells with many roles in development and repair of the CNS. Neurosci. Rev. J. Bringing Neurobiol. Neurol. Psychiatry (2007). [DOI] [PubMed] [Google Scholar]
- 10.Bergles DE & Richardson WD Oligodendrocyte Development and Plasticity. Cold Spring Harb. Perspect. Biol 8, a020453 (2015). [DOI] [PMC free article] [PubMed] [Google Scholar]
- 11.Kirby BB et al. In vivo time-lapse imaging shows dynamic oligodendrocyte progenitor behavior during zebrafish development. Nat. Neurosci 9, 1506–1511 (2006). [DOI] [PubMed] [Google Scholar]
- 12.Hughes EG, Kang SH, Fukaya M & Bergles DE Oligodendrocyte progenitors balance growth with self-repulsion to achieve homeostasis in the adult brain. Nat. Neurosci 16, 668–676 (2013). [DOI] [PMC free article] [PubMed] [Google Scholar]
- 13.Auer F, Vagionitis S & Czopka T Evidence for myelin sheath remodeling in the CNS revealed by in vivo imaging. Curr. Biol 28, 549–559.e3 (2018). [DOI] [PubMed] [Google Scholar]
- 14.Hill RA, Patel KD, Goncalves CM, Grutzendler J & Nishiyama A Modulation of oligodendrocyte generation during a critical temporal window after NG2 cell division. Nat. Neurosci 17, 1518–1527 (2014). [DOI] [PMC free article] [PubMed] [Google Scholar]
- 15.Spitzer SO et al. Oligodendrocyte Progenitor Cells Become Regionally Diverse and Heterogeneous with Age. Neuron 101, 459–471.e5 (2019). [DOI] [PMC free article] [PubMed] [Google Scholar]
- 16.Viganò F, Möbius W, Götz M & Dimou L Transplantation reveals regional differences in oligodendrocyte differentiation in the adult brain. Nat. Neurosci 16, 1370–1372 (2013). [DOI] [PubMed] [Google Scholar]
- 17.Marisca R et al. Functionally distinct subgroups of oligodendrocyte precursor cells integrate neural activity and execute myelin formation. Nat. Neurosci 1–12 (2020) doi: 10.1038/s41593-019-0581-2. [DOI] [PMC free article] [PubMed] [Google Scholar]
- 18.Hill RA, Patel KD, Medved J, Reiss AM & Nishiyama A NG2 cells in white matter but not gray matter proliferate in response to PDGF. J. Neurosci 33, 14558–14566 (2013). [DOI] [PMC free article] [PubMed] [Google Scholar]
- 19.Shen S et al. Age-dependent epigenetic control of differentiation inhibitors is critical for remyelination efficiency. Nat. Neurosci 11, 1024–1034 (2008). [DOI] [PMC free article] [PubMed] [Google Scholar]
- 20.Chacon-De-La-Rocha I et al. Accelerated Dystrophy and Decay of Oligodendrocyte Precursor Cells in the APP/PS1 Model of Alzheimer’s-Like Pathology. Front. Cell. Neurosci 14, (2020). [DOI] [PMC free article] [PubMed] [Google Scholar]
- 21.Koudelka S et al. Individual Neuronal Subtypes Exhibit Diversity in CNS Myelination Mediated by Synaptic Vesicle Release. Curr. Biol. CB 26, 1447–1455 (2016). [DOI] [PMC free article] [PubMed] [Google Scholar]
- 22.Goebbels S et al. A neuronal PI(3,4,5)P3-dependent program of oligodendrocyte precursor recruitment and myelination. Nat. Neurosci 20, 10–15 (2017). [DOI] [PubMed] [Google Scholar]
- 23.Seidl AH Regulation of conduction time along axons. Neuroscience 276, 126–134 (2014). [DOI] [PMC free article] [PubMed] [Google Scholar]
- 24.Osso LA & Chan JR Architecting the myelin landscape. Curr. Opin. Neurobiol 47, 1–7 (2017). [DOI] [PMC free article] [PubMed] [Google Scholar]
- 25.Hines JH, Ravanelli AM, Schwindt R, Scott EK & Appel B Neuronal activity biases axon selection for myelination in vivo. Nat. Neurosci 18, 683–689 (2015). [DOI] [PMC free article] [PubMed] [Google Scholar]
- 26.Mitew S et al. Pharmacogenetic stimulation of neuronal activity increases myelination in an axon-specific manner. Nat. Commun 9, 306 (2018). [DOI] [PMC free article] [PubMed] [Google Scholar]
- 27.Mensch S et al. Synaptic vesicle release regulates myelin sheath number of individual oligodendrocytes in vivo. Nat. Neurosci 18, 628–630 (2015). [DOI] [PMC free article] [PubMed] [Google Scholar]
- 28.Bacmeister CM et al. Motor learning promotes remyelination via new and surviving oligodendrocytes. Nat. Neurosci 23, 819–831 (2020). [DOI] [PMC free article] [PubMed] [Google Scholar]
- 29.Orthmann-Murphy J et al. Remyelination alters the pattern of myelin in the cerebral cortex. eLife 9, (2020). [DOI] [PMC free article] [PubMed] [Google Scholar]
- 30.Snaidero N et al. Myelin replacement triggered by single-cell demyelination in mouse cortex. Nat. Commun 11, 4901 (2020). [DOI] [PMC free article] [PubMed] [Google Scholar]
- 31.Hill RA, Damisah EC, Chen F, Kwan AC & Grutzendler J Targeted two-photon chemical apoptotic ablation of defined cell types in vivo. Nat. Commun 8, 15837 (2017). [DOI] [PMC free article] [PubMed] [Google Scholar]
- 32.Damisah EC et al. Astrocytes and microglia play orchestrated roles and respect phagocytic territories during neuronal corpse removal in vivo. Sci. Adv 6, eaba3239 (2020). [DOI] [PMC free article] [PubMed] [Google Scholar]
- 33.Deng Y et al. Direct visualization of membrane architecture of myelinating cells in transgenic mice expressing membrane-anchored EGFP. Genesis 52, 341–349 (2014). [DOI] [PMC free article] [PubMed] [Google Scholar]
- 34.Hill RA, Li AM & Grutzendler J Lifelong cortical myelin plasticity and age-related degeneration in the live mammalian brain. Nat. Neurosci 21, 683–695 (2018). [DOI] [PMC free article] [PubMed] [Google Scholar]
- 35.Davalos D et al. ATP mediates rapid microglial response to local brain injury in vivo. Nat. Neurosci 8, 752–758 (2005). [DOI] [PubMed] [Google Scholar]
- 36.Schain AJ, Hill RA & Grutzendler J Label-free in vivo imaging of myelinated axons in health and disease with spectral confocal reflectance microscopy. Nat. Med 20, 443–449 (2014). [DOI] [PMC free article] [PubMed] [Google Scholar]
- 37.Hill RA & Grutzendler J In vivo imaging of oligodendrocytes with sulforhodamine 101. Nat. Methods 11, 1081–1082 (2014). [DOI] [PMC free article] [PubMed] [Google Scholar]
- 38.Fard MK et al. BCAS1 expression defines a population of early myelinating oligodendrocytes in multiple sclerosis lesions. Sci. Transl. Med 9, eaam7816 (2017). [DOI] [PMC free article] [PubMed] [Google Scholar]
- 39.Guo F & Wang Y TCF7l2, a nuclear marker that labels premyelinating oligodendrocytes and promotes oligodendroglial lineage progression. Glia (2022) doi: 10.1002/glia.24249. [DOI] [PMC free article] [PubMed] [Google Scholar]
- 40.Lecca D, Raffaele S, Abbracchio MP & Fumagalli M Regulation and signaling of the GPR17 receptor in oligodendroglial cells. Glia 68, 1957–1967 (2020). [DOI] [PubMed] [Google Scholar]
- 41.Peters A The effects of normal aging on myelin and nerve fibers: a review. J. Neurocytol 31, 581–593 (2002). [DOI] [PubMed] [Google Scholar]
- 42.Marshall-Phelps KLH et al. Neuronal activity disrupts myelinated axon integrity in the absence of NKCC1b. J. Cell Biol 219, (2020). [DOI] [PMC free article] [PubMed] [Google Scholar]
- 43.Traka M et al. A genetic mouse model of adult-onset, pervasive central nervous system demyelination with robust remyelination. Brain J. Neurol 133, 3017–3029 (2010). [DOI] [PMC free article] [PubMed] [Google Scholar]
- 44.Gardner C et al. Cortical grey matter demyelination can be induced by elevated pro-inflammatory cytokines in the subarachnoid space of MOG-immunized rats. Brain J. Neurol 136, 3596–3608 (2013). [DOI] [PubMed] [Google Scholar]
- 45.Sachs HH, Bercury KK, Popescu DC, Narayanan SP & Macklin WB A new model of cuprizone-mediated demyelination/remyelination. ASN Neuro 6, (2014). [DOI] [PMC free article] [PubMed] [Google Scholar]
- 46.Matsushima GK & Morell P The neurotoxicant, cuprizone, as a model to study demyelination and remyelination in the central nervous system. Brain Pathol. Zurich Switz (2001). [DOI] [PMC free article] [PubMed] [Google Scholar]
- 47.Czopka T, Ffrench-Constant C & Lyons DA Individual oligodendrocytes have only a few hours in which to generate new myelin sheaths in vivo. Dev. Cell 25, 599–609 (2013). [DOI] [PMC free article] [PubMed] [Google Scholar]
- 48.Snaidero N et al. Myelin membrane wrapping of CNS axons by PI(3,4,5)P3-dependent polarized growth at the inner tongue. Cell 156, 277–290 (2014). [DOI] [PMC free article] [PubMed] [Google Scholar]
- 49.Snaidero N et al. Antagonistic Functions of MBP and CNP Establish Cytosolic Channels in CNS Myelin. Cell Rep. 18, 314–323 (2017). [DOI] [PMC free article] [PubMed] [Google Scholar]
- 50.Yeung MSY et al. Dynamics of oligodendrocyte generation in multiple sclerosis. Nature 566, 538–542 (2019). [DOI] [PMC free article] [PubMed] [Google Scholar]
- 51.Jäkel S et al. Altered human oligodendrocyte heterogeneity in multiple sclerosis. Nature 566, 543–547 (2019). [DOI] [PMC free article] [PubMed] [Google Scholar]
- 52.Neely SA et al. New oligodendrocytes exhibit more abundant and accurate myelin regeneration than those that survive demyelination. Nat. Neurosci 1–6 (2022) doi: 10.1038/s41593-021-01009-x. [DOI] [PMC free article] [PubMed] [Google Scholar]
- 53.Marques S et al. Oligodendrocyte heterogeneity in the mouse juvenile and adult central nervous system. Science 352, 1326–1329 (2016). [DOI] [PMC free article] [PubMed] [Google Scholar]
- 54.Chen Y et al. The oligodendrocyte-specific G protein-coupled receptor GPR17 is a cell-intrinsic timer of myelination. Nat. Neurosci 12, 1398–1406 (2009). [DOI] [PMC free article] [PubMed] [Google Scholar]
- 55.Ou Z et al. Olig2-Targeted G-Protein-Coupled Receptor Gpr17 Regulates Oligodendrocyte Survival in Response to Lysolecithin-Induced Demyelination. J. Neurosci. Off. J. Soc. Neurosci 36, 10560–10573 (2016). [DOI] [PMC free article] [PubMed] [Google Scholar]
- 56.Wang J et al. Robust Myelination of Regenerated Axons Induced by Combined Manipulations of GPR17 and Microglia. Neuron 108, 876–886.e4 (2020). [DOI] [PMC free article] [PubMed] [Google Scholar]
- 57.Boda E et al. The GPR17 receptor in NG2 expressing cells: focus on in vivo cell maturation and participation in acute trauma and chronic damage. Glia 59, 1958–1973 (2011). [DOI] [PubMed] [Google Scholar]
- 58.Haroutunian V et al. Myelination, oligodendrocytes, and serious mental illness. Glia 62, 1856–1877 (2014). [DOI] [PubMed] [Google Scholar]
- 59.Sim FJ, Zhao C, Penderis J & Franklin RJM The age-related decrease in CNS remyelination efficiency is attributable to an impairment of both oligodendrocyte progenitor recruitment and differentiation. J. Neurosci. Off. J. Soc. Neurosci 22, 2451–2459 (2002). [DOI] [PMC free article] [PubMed] [Google Scholar]
- 60.Kotter MR, Li W-W, Zhao C & Franklin RJM Myelin Impairs CNS Remyelination by Inhibiting Oligodendrocyte Precursor Cell Differentiation. J. Neurosci 26, 328–332 (2006). [DOI] [PMC free article] [PubMed] [Google Scholar]
- 61.Tse K-H & Herrup K DNA damage in the oligodendrocyte lineage and its role in brain aging. Mech. Ageing Dev 161, 37–50 (2017). [DOI] [PMC free article] [PubMed] [Google Scholar]
- 62.Zhu X et al. Age-dependent fate and lineage restriction of single NG2 cells. Development 138, 745–753 (2011). [DOI] [PMC free article] [PubMed] [Google Scholar]
- 63.Yona S et al. Fate mapping reveals origins and dynamics of monocytes and tissue macrophages under homeostasis. Immunity 38, 79–91 (2013). [DOI] [PMC free article] [PubMed] [Google Scholar]
- 64.Madisen L et al. A robust and high-throughput Cre reporting and characterization system for the whole mouse brain. Nat. Neurosci 13, 133–140 (2010). [DOI] [PMC free article] [PubMed] [Google Scholar]
- 65.Lecca D et al. The recently identified P2Y-like receptor GPR17 is a sensor of brain damage and a new target for brain repair. PloS One 3, e3579 (2008). [DOI] [PMC free article] [PubMed] [Google Scholar]
- 66.Ciana P et al. The orphan receptor GPR17 identified as a new dual uracil nucleotides/cysteinyl-leukotrienes receptor. EMBO J. 25, 4615–4627 (2006). [DOI] [PMC free article] [PubMed] [Google Scholar]
- 67.Ferreira TA et al. Neuronal morphometry directly from bitmap images. Nat. Methods 11, 982–984 (2014). [DOI] [PMC free article] [PubMed] [Google Scholar]
Associated Data
This section collects any data citations, data availability statements, or supplementary materials included in this article.
Supplementary Materials
Supplementary Video 1: Oligodendrocyte degeneration following 2Phatal
In-vivo time series showing the degeneration of a mEGFP labeled oligodendrocyte following 2Phatal. The dashed line represents the soma diameter before 2Phatal. Soma condensation occurs within the first 14 days, while final cell death does not occur until 49 days following photobleaching. Images were acquired in layer I of the somatosensory cortex. (Frame rate: 2 frames per second)
Supplementary Video 2: OPC division
In-vivo time series in a Cnp-mEGFP:Cspg4-creER:tdTomato mouse showing OPC (magenta) division events. Arrows denote OPC that undergo division. Images were acquired in layer I of the somatosensory cortex. (Frame rate: 2 frames per second)
Supplementary Video 3: OPC apoptosis
In-vivo time series in a Cnp-mEGFP:Cspg4-creER:tdTomato mouse showing OPC (magenta) apoptosis. Note the appearance of apoptotic bodies on day 62, which are cleared by day 64. Images were acquired in layer I of the somatosensory cortex. (Frame rate: 2 frames per second)
Supplementary Video 4: Generation of oligodendrocytes from OPCs
In-vivo time series in a Cnp-mEGFP:Cspg4-creER:tdTomato mouse showing the differentiation of an OPC (magenta) into a myelinating oligodendrocyte. Following differentiation, the soma contracts and becomes stationary. Newly formed myelin is evident as it is dual labeled with mEGFP (green) and tdTomato (magenta). (Frame rate: 2 frames per second)
Supplementary Video 5: Long term in-vivo imaging of OPCs and oligodendrocytes
In-vivo time series in a Cnp-mEGFP:Cspg4-creER:tdTomato control mouse, not targeted with 2Phatal, demonstrating the behavior of oligodendrocytes (green) and OPCs in layer I of the somatosensory cortex. As new oligodendrocytes are generated, myelin density increases. Dates represent days postnatal (postnatal 62 – postnatal 102). (Frame rate: 2 frames per second)
Supplementary Video 6: Dynamics of oligodendrocyte degeneration, OPC fate, and rapid remyelination following oligodendrocyte 2Phatal
In-vivo time series showing the degeneration of an oligodendrocyte (green) targeted with 2Phatal and local OPC (magenta) behavior. Oligodendrocyte degeneration (orange arrowhead) occurs over 40 days, characterized by rapid soma condensation. Throughout and following the degeneration, neighboring OPCs respond to the death via differentiation and remyelination.
Supplementary Video 7: Remyelination following myelin sheath degeneration
Expanded time series of the sheath degeneration and repair sequence used in Fig. 5, including SCoRe microscopy (yellow). Remyelination is clearly visible due to the presence of tdTomato fluorescence (magenta) in the newly forming sheath. Note that cytoplasmic tdTomato fluorescence intensity is highest when the remyelinating sheath is first formed (day 44) and not yet compact, as evident by the lack of SCoRe signal. (Frame rate: 2 frames per second)
Data Availability Statement
All data used for quantification and statistical comparisons are provided in the source data file associated with each figure. All imaging data files are available on an unrestricted basis from the corresponding author.


