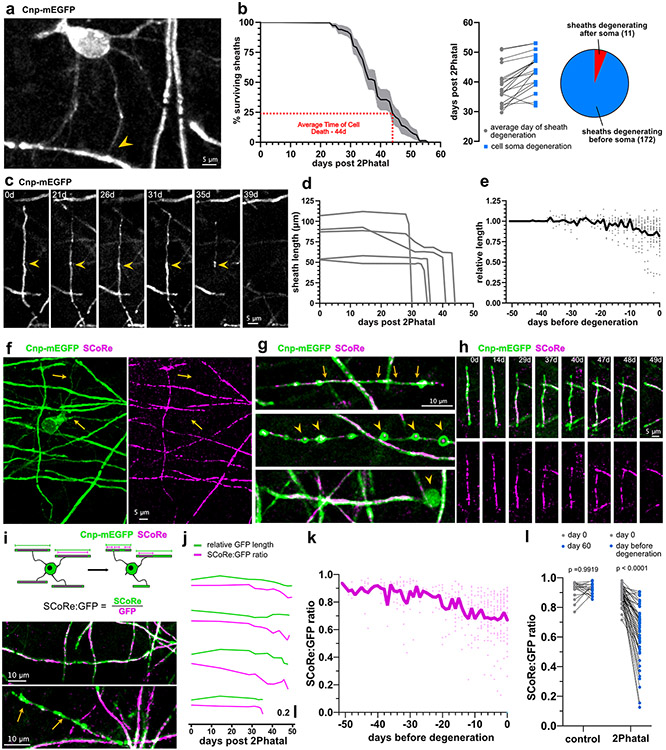
Fig. 2 ∣. Myelin sheath degeneration occurs via distinct phases of retraction and membrane decompaction.
(a) In-vivo imaging of CNP-mEGFP reveals oligodendrocyte proximal processes and their connection with the myelin sheath (arrowhead). (b) Temporal dynamics of sheath degeneration. (n=19 cells, 183 sheaths, 4 mice, error is SEM). Average time to sheath degeneration compared to cell soma loss and breakdown of sheaths degenerating before or after their attached soma for all sheaths analyzed. (c) In vivo image sequence of a myelin sheath thinning and retracting over weeks after 2Phatal. (d) Representative length changes of sheaths produced by one 2Phatal-targeted oligodendrocyte. (e) Relative length changes in all myelin sheaths leading up to the day of their degeneration (gray dots indicate single sheath measurements, n = 49 sheaths, 4 mice). The overlayed black trace represents the mean. (f) In vivo image indicating that the SCoRe (myelin compaction) signal is absent from proximal processes (arrows). (g) Common myelin sheath pathology observed during 2Phatal induced degeneration, including sheath thinning (top, between arrows), balloon formation (middle, arrowheads) and myelin debris accumulation (bottom, arrowhead). (h) Representative time sequence of a degenerating sheath visualized with fluorescence and SCoRe microscopy. (i) SCoRe to GFP ratios were calculated to determine SCoRe coverage along myelin sheaths (top). This value was used to distinguish compact sheaths (middle) from uncompacted sheaths (bottom, yellow arrows). (j) Representative traces of GFP length (green) and SCoRe:GFP ratio (magenta) from 4 sheaths. (k) SCoRe:GFP ratios of all internodes normalized to the day of sheath degeneration (n= 9 sheaths, 4 mice). The overlayed blue trace represents the mean. (l) SCoRe:GFP ratios of control and degenerating sheaths at day 0 vs day 60 for control or the day before degeneration for 2Phatal (n=19 control sheaths and n=49 2Phatal sheaths, 4 mice, two-way ANOVA, Holm-Sidak multiple comparisons, comparison of 2Phatal SCoRe:GFP ratio between day 0 and 60 p = 4x10⁻¹⁵).

