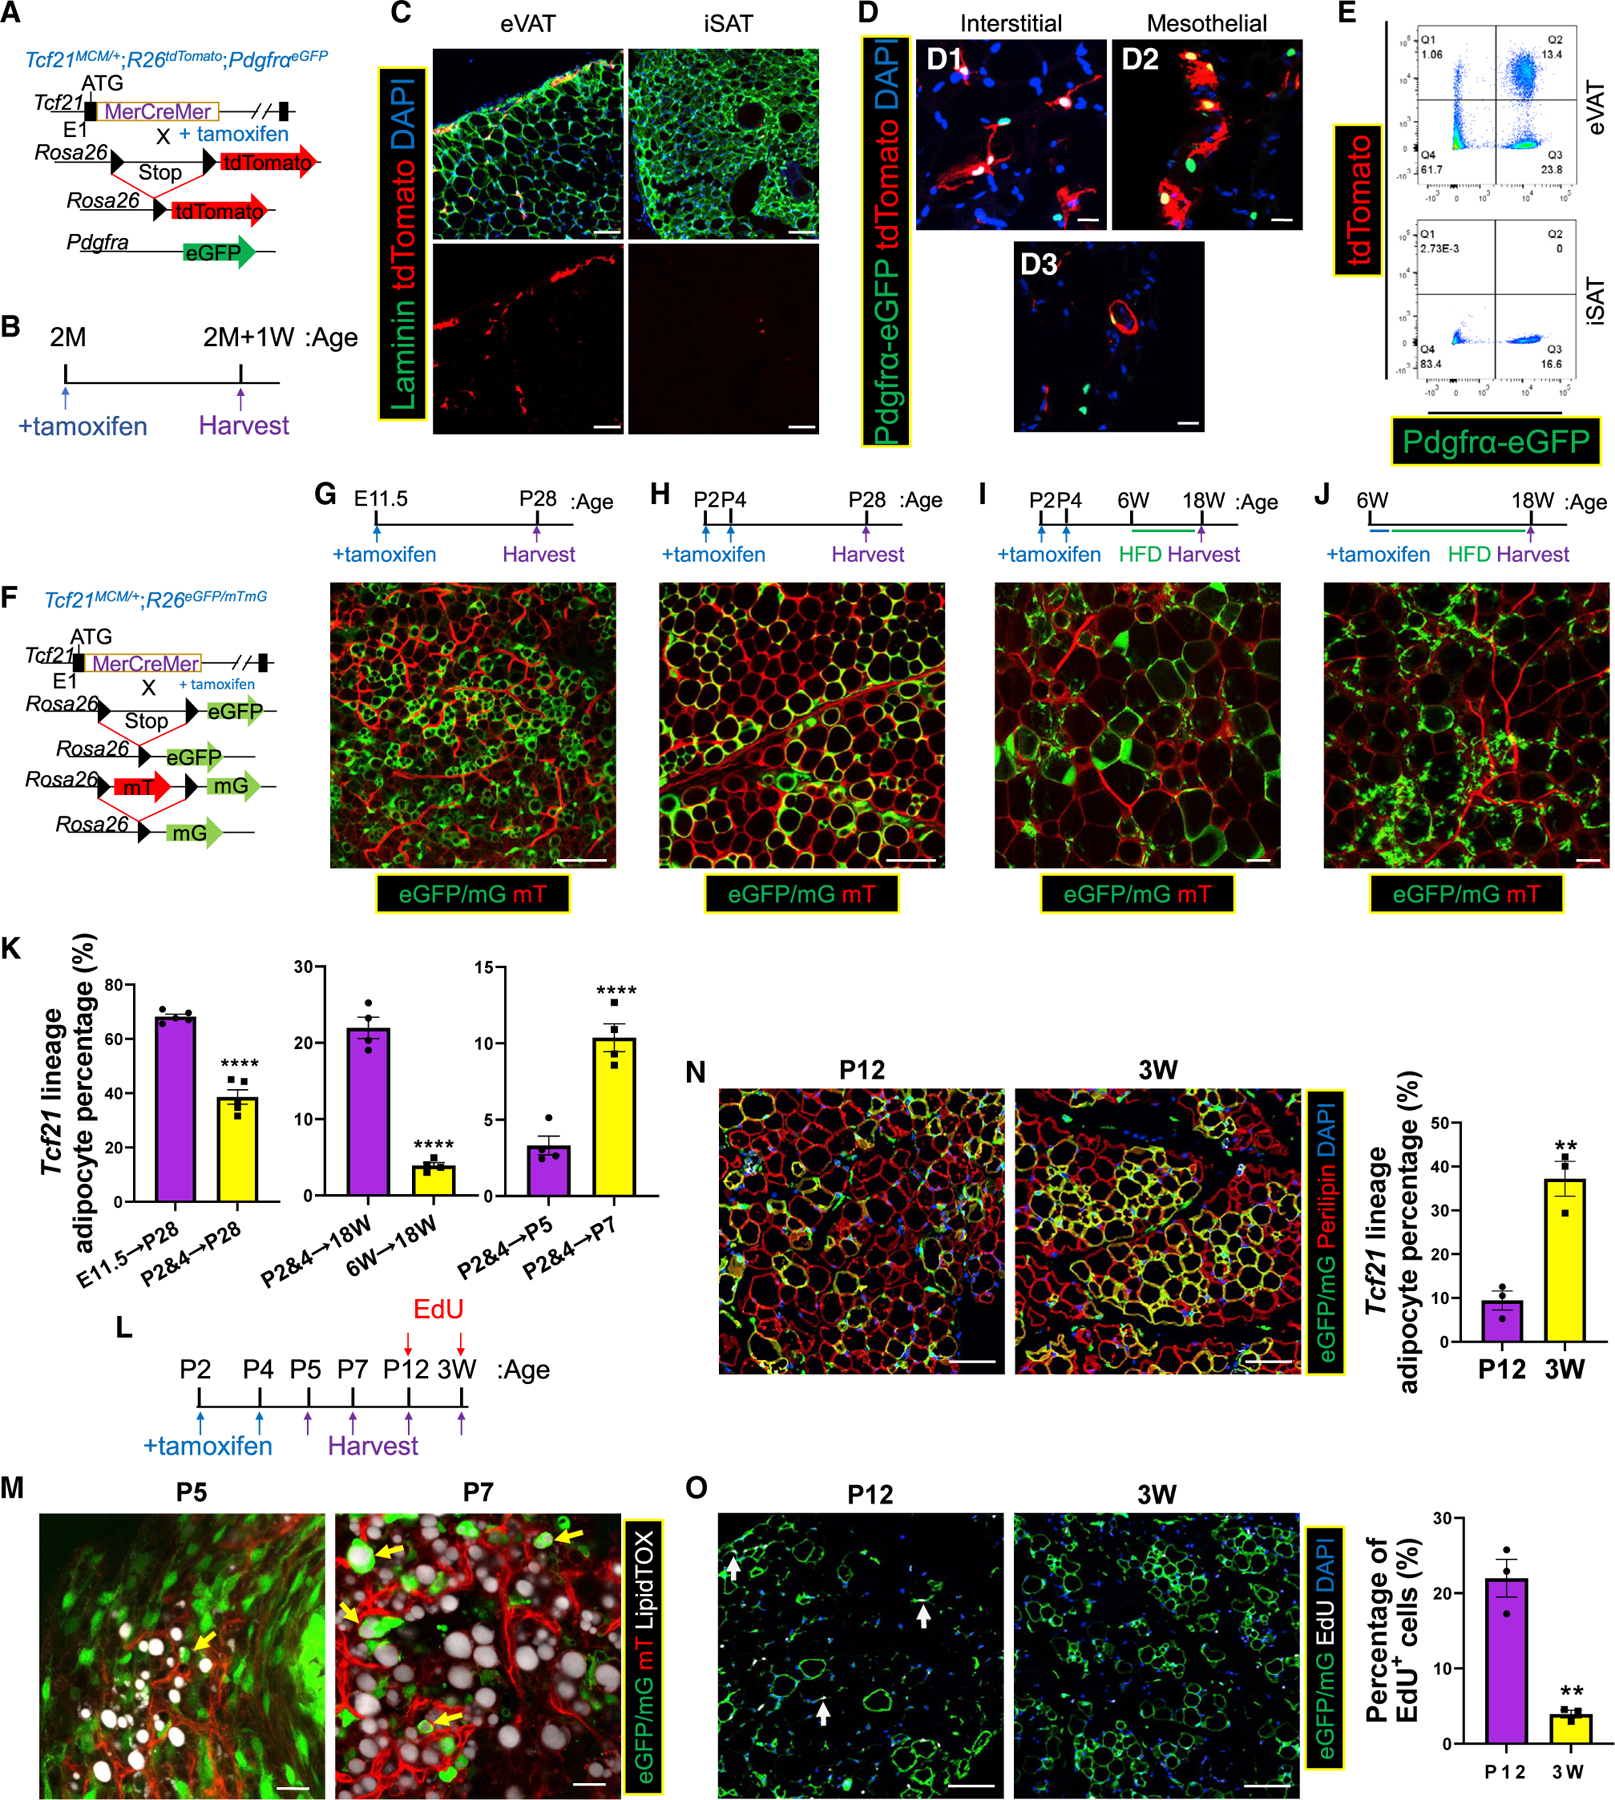
Figure 1. Tcf21 LCs give rise to visceral adipocytes.

(A and B) Schematics of the generation of Tcf21MCM/+;R26tdTomato;PdgfraeGFP mice (A) and TM treatment and sample collection strategy (B).
(C) eVAT and iSAT were subjected to immunohistochemical staining (IHC), identifying Tcf21 LCs. Scale bar, 20 μm.
(D) IHC images showing Pdgfra-eGFP+ Tcf21 lineage mesothelial (D1) and interstitial (D2) non-adipocytes and differentiating adipocytes (D3). Scale bar, 20 μm.
(E) FC analysis of eVAT and iSAT.
(F) Schematic of the generation of Tcf21 LT mice. (G–J) Tcf21 LT mice were treated with TM at the indicated ages and sampled on the indicated days, followed by whole-mount imaging (G–J). Scale bar, 100 μm.
(K) The fractions of Tcf21 lineage-traced adipocytes in (G)–(J) and (M) were quantified.
n = 5 (G and H); n = 4 (I, J, and M); unpaired t test.
(L) Schematic of TM and EdU treatments in Tcf21 LT mice and sample collection at the indicated time points.
(M) eVAT collected at P5 and P7 was stained with LipidTOX and subjected to whole-mount imaging to identify Tcf21 lineage adipocytes (yellow arrows). Scale bar, 20 μm.
(N and O) Sections of eVAT collected on P12 and P21 were subjected to IHC to quantify the percentage of Tcf21 lineage adipocytes (N) and the percentage of EdU+ Tcf21 LCs (white arrows) (O). Scale bar, 100 μm. n = 3; unpaired t test.
**p < 0.01, ****p < 0.0001. Data are represented as mean ± SEM with individual values plotted. See also Figure S1.
