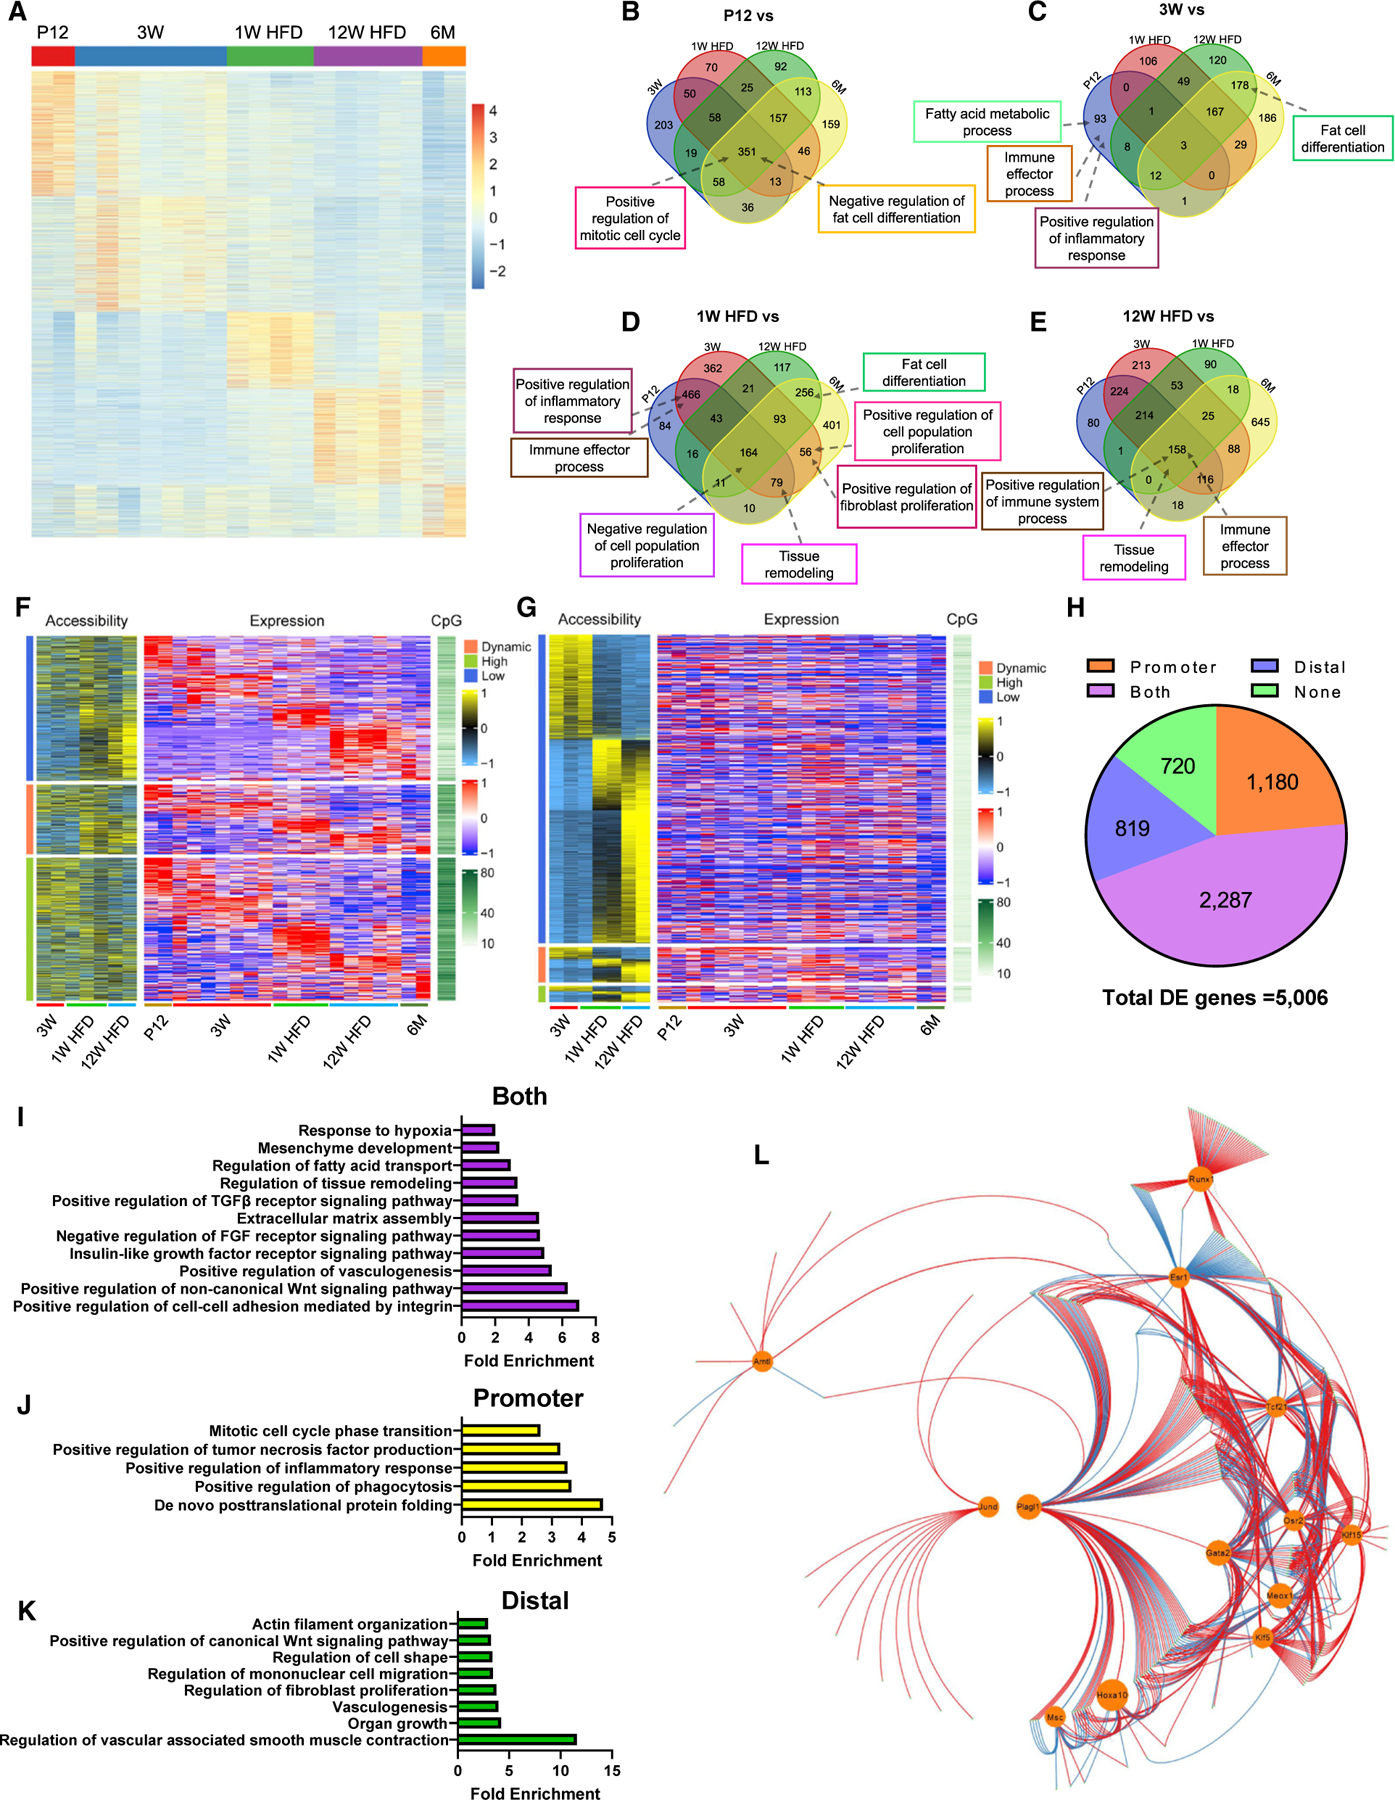
Figure 2. Multiomics analyses identify the GRN regulating Tcf21 LC activities.

(A–E) WT Tcf21 LCs isolated at the indicated time points were subjected to bulk RNA-seq. (A) A heatmap shows the expression of DEGs. See also Table S1. (B–E) Venn diagrams show the overlap of BPs enriched at P12 (B), 3 weeks (C), 1 week HFD (D), or 12 weeks HFD (E) versus other groups.
(F–H) Tcf21 LCs isolated at the indicated time points were subjected to ATAC-seq. (F) A heatmap shows the PA, CpG density, and expression level of DEGs. Genes were grouped based on PA. See also Table S2. (G) A heatmap shows the accessibility and CpG density of DADs and the expression level of proximal genes. Distal peaks were grouped based on the expression of proximal genes. See also Tables S3 and S4. (H) A pie graph shows the numbers of DEGs with expression strongly correlated with PA, distal region accessibility, both of them, or none of them.
(I–K) Representative BPs enriched in DEGs with expression strongly correlated with PA (I), distal region accessibility (J), or both of them (K), revealed by GO analysis. (L) A GRN was constructed using the top 500 DEGs, including 13 TFs (circled). Red and blue lines indicate positive and negative regulation, respectively. See also Table S5.
n = 2, P12 and 6 months (RNA-seq); n = 7, 3 weeks (RNA-seq); n = 4, 1 week HFD (RNA seq); n = 5, 12 weeks HFD (RNA-seq); n = 3, 3 weeks (ATAC-seq); n = 2, 1 week and 12 weeks HFD (ATAC-seq). See also Figures S2 and S3 and Tables S1, S2, S3, S4, and S5.
