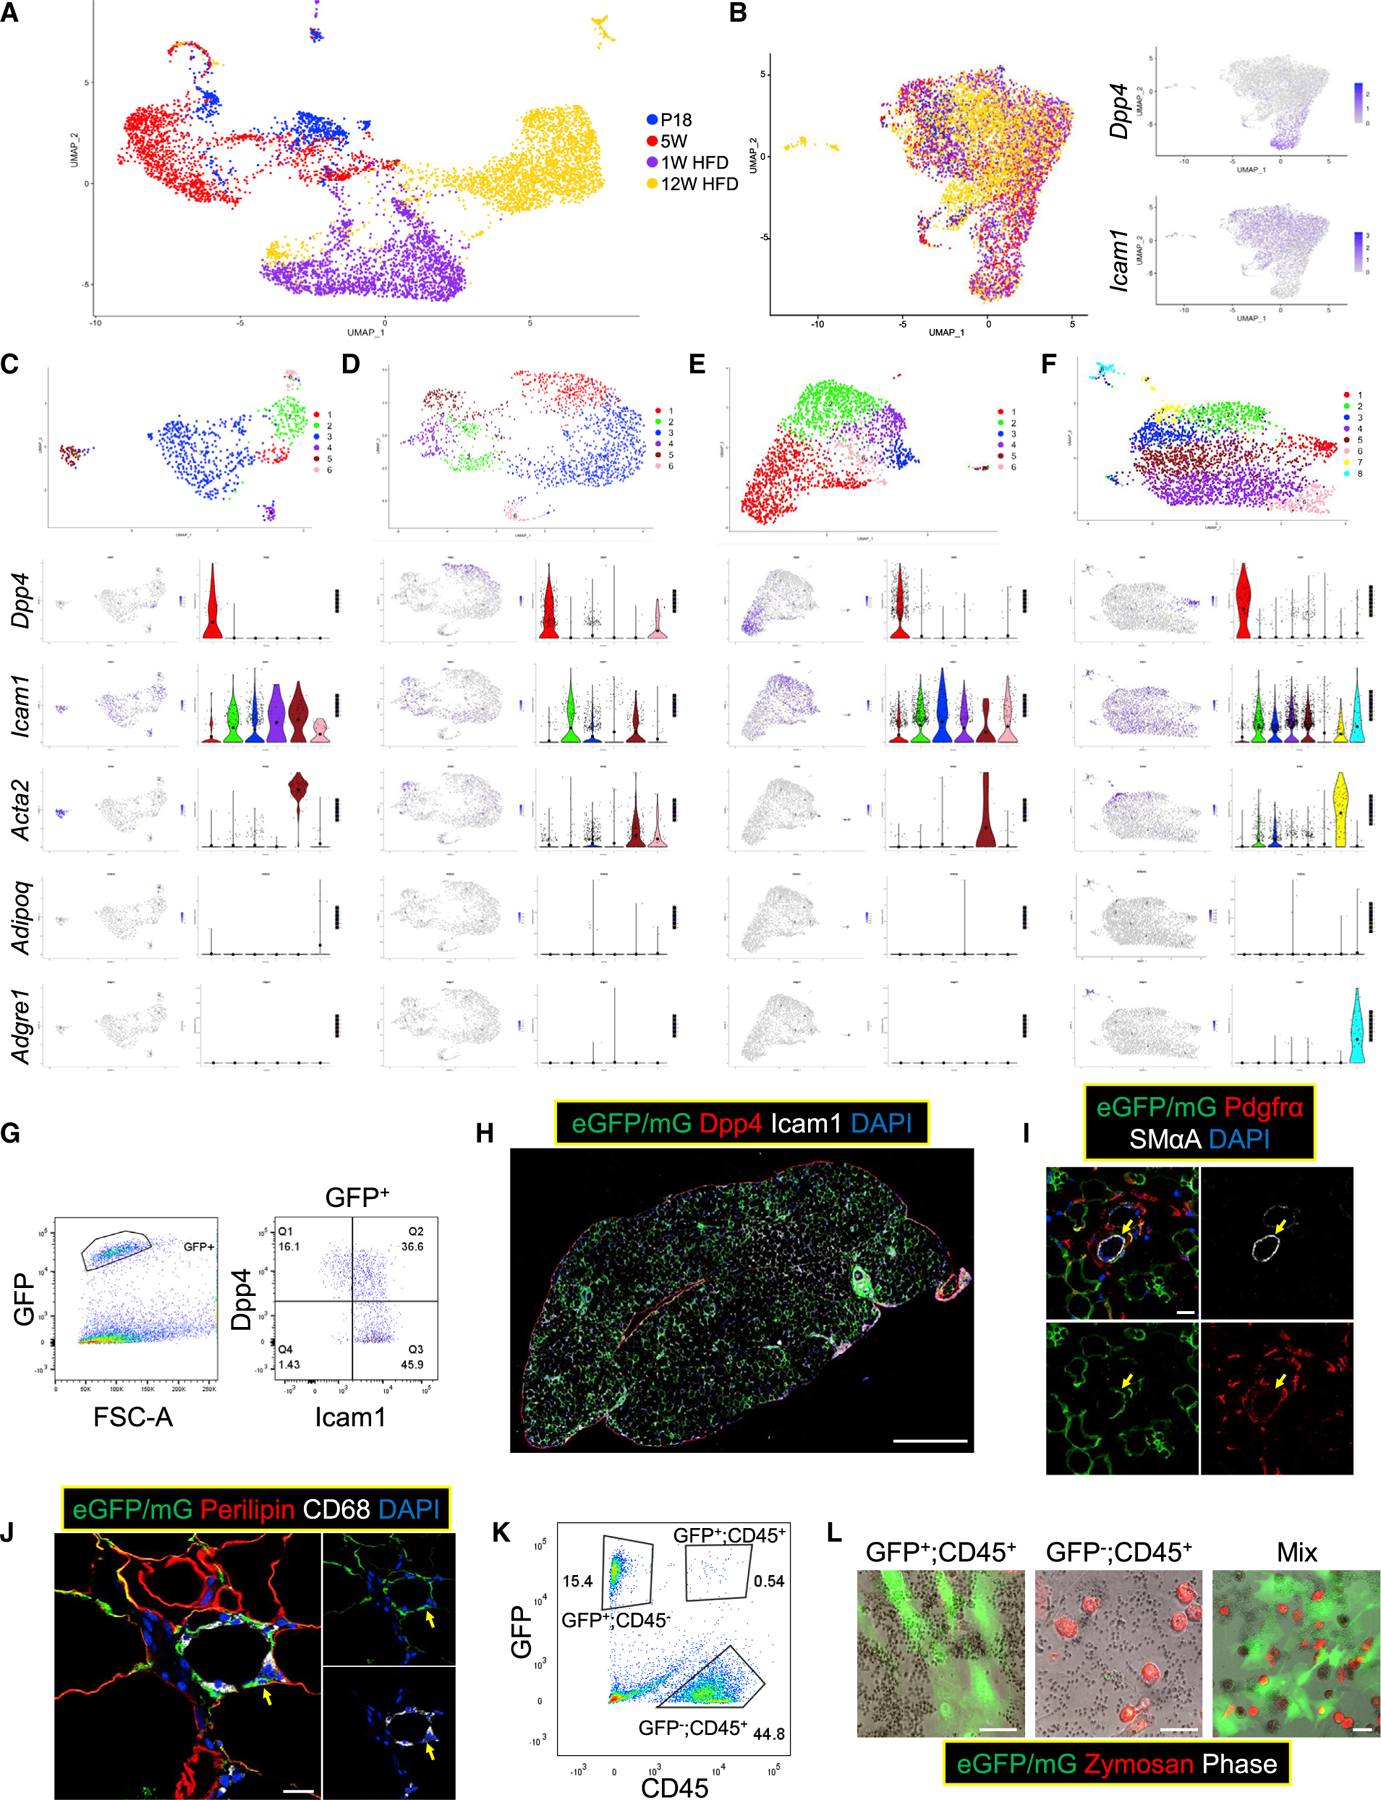
Figure 3. scRNA-seq analysis identifies the cell type composition of Tcf21 LCs.

(A and B) scRNAseq was performed using WT Tcf21 LCs isolated at P18 (739 cells), 5 weeks (1,678 cells), 1 week HFD (2,008 cells), and 12 weeks HFD (2,835 cells). Uniform Manifold Approximation and Projection (UMAP) graphs show the clustering of all 7,260 Tcf21 LCs without (A) and with (B) batch correction. The expression of Dpp4 and Icam1 is also shown in (B).
(C–F) Cells of each sample were subjected to separate clustering analyses (C, P18; D, 5 weeks; E, 1 week HFD; F, 12 weeks HFD). UMAP graphs and violin plots show the expression of select genes. Large solid circles indicate expression means.
(G and H) FC (G) and IHC (H) identify Dpp4+ and Icam1+ Tcf21 LCs in eVAT at 3 weeks. Scale bar, 100 μm.
(I) IHC shows the presence of smooth muscle alpha actin (SMαA)+;Pdgfrα− Tcf21 lineage VSMCs (yellow arrows) in eVAT at 3 weeks. Scale bar, 20 μm.
(J) IHC images show the presence of Tcf21 lineage CD68+ cells (yellow arrows) in eVAT at 12 weeks HFD. Scale bar, 20 μm.
(K and L) Tcf21 lineage CD45+ cells and non-Tcf21 lineage CD45+ cells were sorted from Tcf21 LT mice at 12 weeks HFD (K) and subjected to a phagocytosis test separately or in a co-culture system (L). Scale bar, 50 μm. See also Figure S4.
