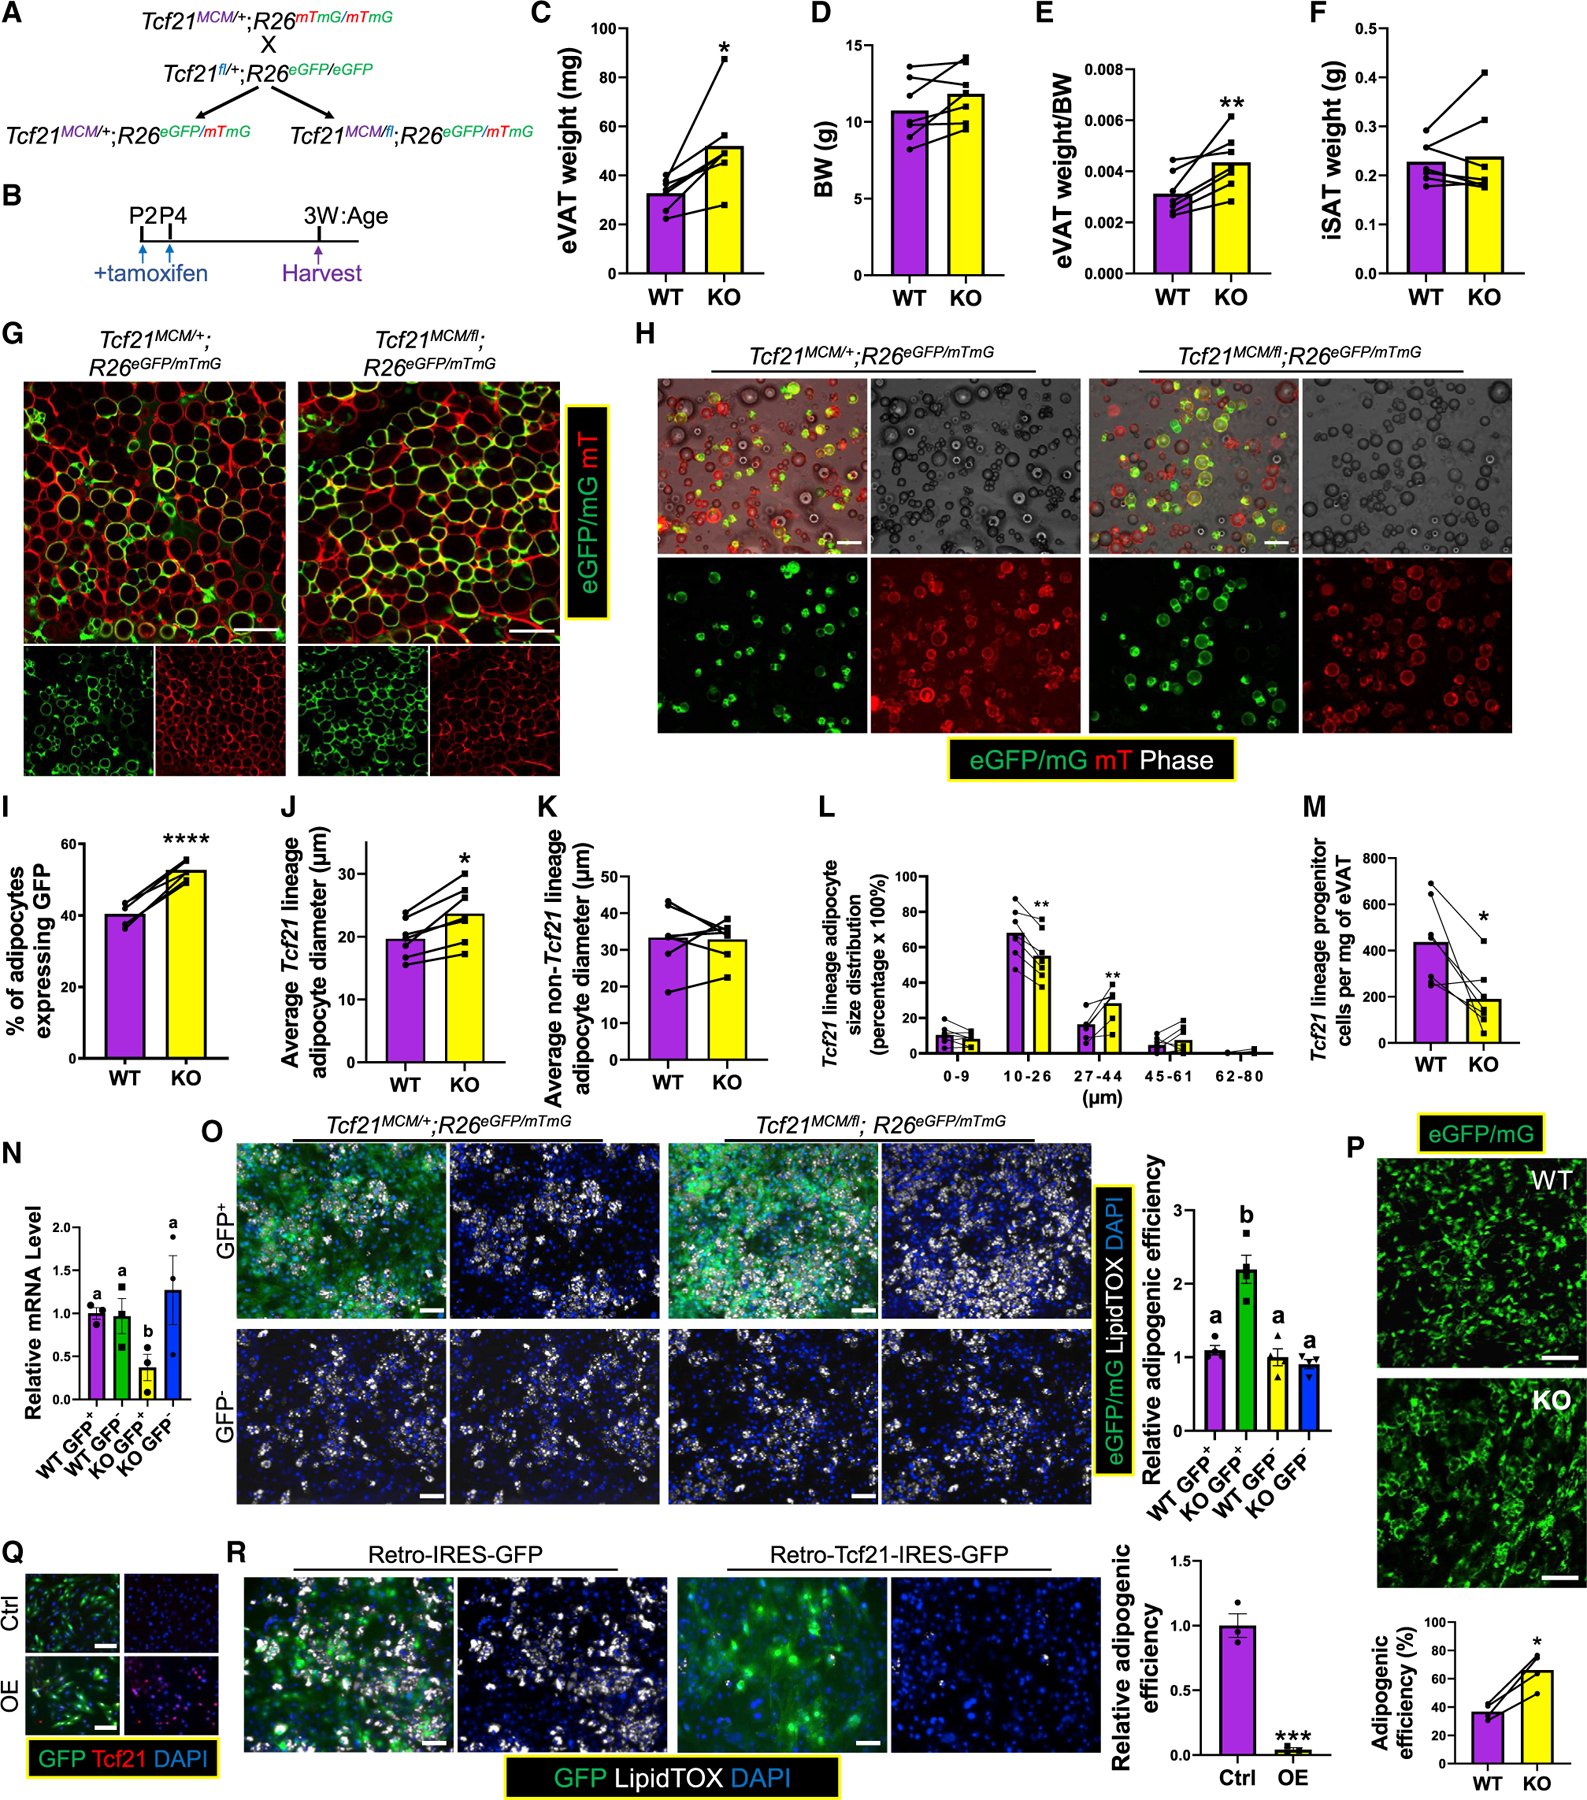
Figure 4. Tcf21 inhibits Tcf21 LC adipogenesis.

(A and B) Schematics of the generation of WT and KO littermate mice (A) and TM treatments and sample collection strategy (B).
(C–F) eVAT weight (C), BW (D), eVAT weight/BW ratio (E), and iSAT weight (F) were obtained. n = 7; paired t test.
(G) eVAT was subjected to whole-mount imaging. Scale bar, 100 μm. (H–L) Adipocytes released from eVAT (H) were analyzed to calculate the fraction of Tcf21 lineage adipocytes (I), their average size (J) and size distribution (L), and the average size of non-Tcf21 lineage adipocytes (K). Scale bar, 100 μm. n = 7; paired t test.
(M) FC measures the density of Tcf21 LCs in eVAT. n = 7; paired t test.
(N and O) Tcf21 LCs and non-Tcf21 LCs sorted from WT and KO littermates at 3 weeks were measured for Tcf21 expression by real-time PCR (N) and induced for adipogenesis, followed by LipidTOX staining (O). Scale bar, 50 μm. n = 4 (N), n = 3 (O); one-way ANOVA. Different letters indicate significant differences (p < 0.05).
(P) The adipogenic efficiency of transplanted WT and KO Tcf21 LCs was quantified. Scale bar, 100 μm. n = 4; unpaired t test.
(Q and R) SVCs isolated from 3-week C57BL/6 mice were transduced with IRES (internal ribosome entry site) -GFP (control, abbreviated as Ctrl) or Tcf21-IRES-GFP (OE) retroviruses, verified for Tcf21 OE by immunocytochemical staining (ICC) (Q), and induced for adipogenesis followed by LipidTOX staining (R). Scale bar, 50 μm.
*p < 0.05, **p < 0.01, ***p < 0.001, ****p < 0.0001. Data are represented as mean with values of littermates connected (C–M and P) or mean ± SEM with individual values plotted (N and R).
