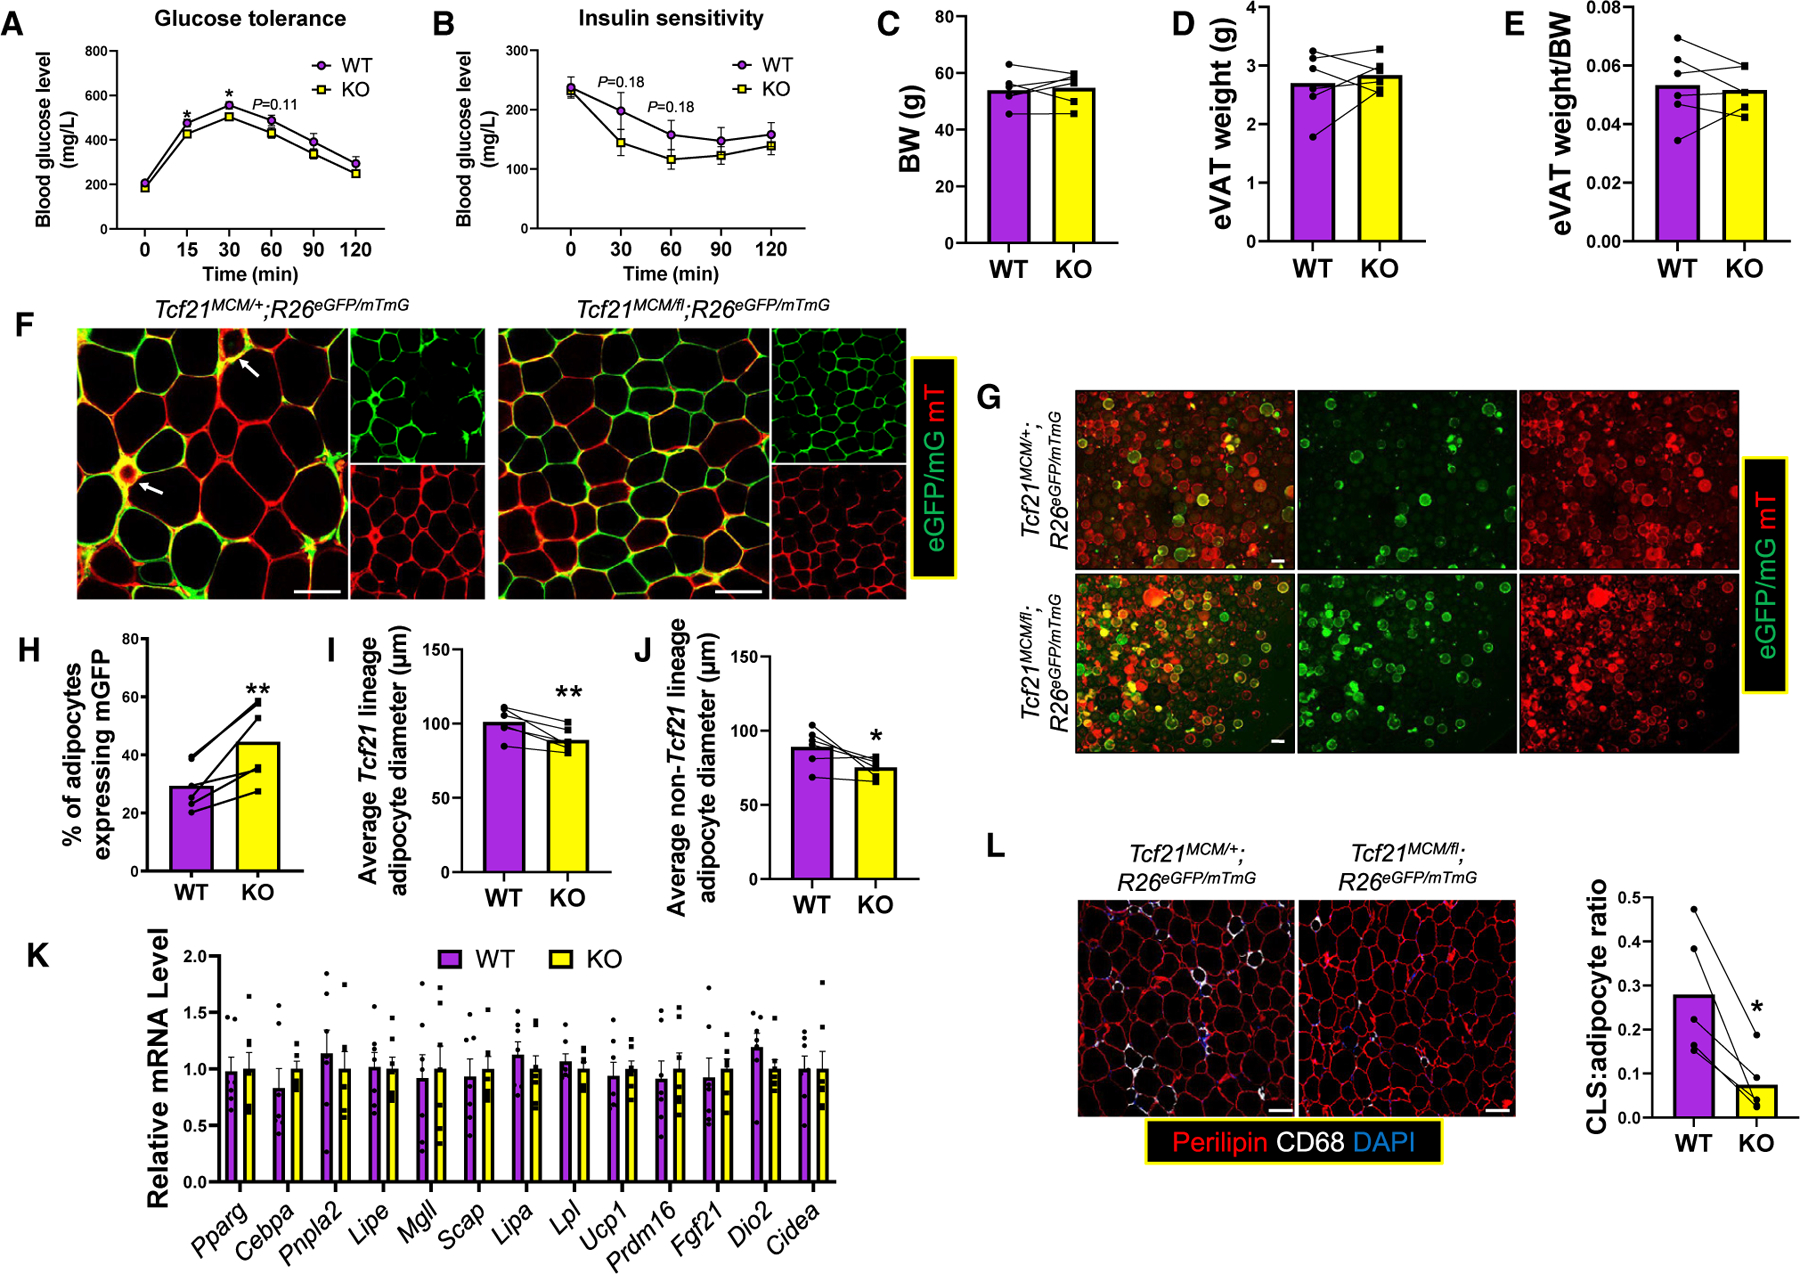
Figure 5. Neonatal deletion of Tcf21 improves obese mouse metabolic health.

(A and B) WT and KO male littermates treated with TM on P2 and P4 were subjected to 12 weeks HFD starting at 6 weeks of age. Glucose tolerance tests (GTTs; A) and insulin tolerance tests (ITTs; B) were performed. n = 8; unpaired t test.
(C–E) The BW (C), eVAT weight (D), and eVAT weight/BW ratio (E) were obtained. n = 8; paired t test.
(F) eVAT was subjected to whole-mount imaging. Scale bar, 100 μm.
(G–J) Adipocytes released from eVAT (G) were analyzed to calculate the percentage of Tcf21 lineage adipocytes (H) and the average sizes of Tcf21 lineage adipocytes (I) and non-Tcf21 lineage adipocytes (J). n = 6; paired t test. Scale bar, 100 μm.
(K) The expression of select genes in adipocytes isolated from HFD-treated WT and KO mice was measured. n = 7; unpaired t test.
(L) eVAT sections were analyzed by IHC to identify CLSs (CD68+;Perilipin−) and calculate the CLS/adipocyte ratio. n = 5; paired t test. Scale bar, 100 μm.
*p < 0.05, **p < 0.01. Data are represented as mean ± SEM (A, B, and K) or mean with values of littermates connected (C–J and L).
