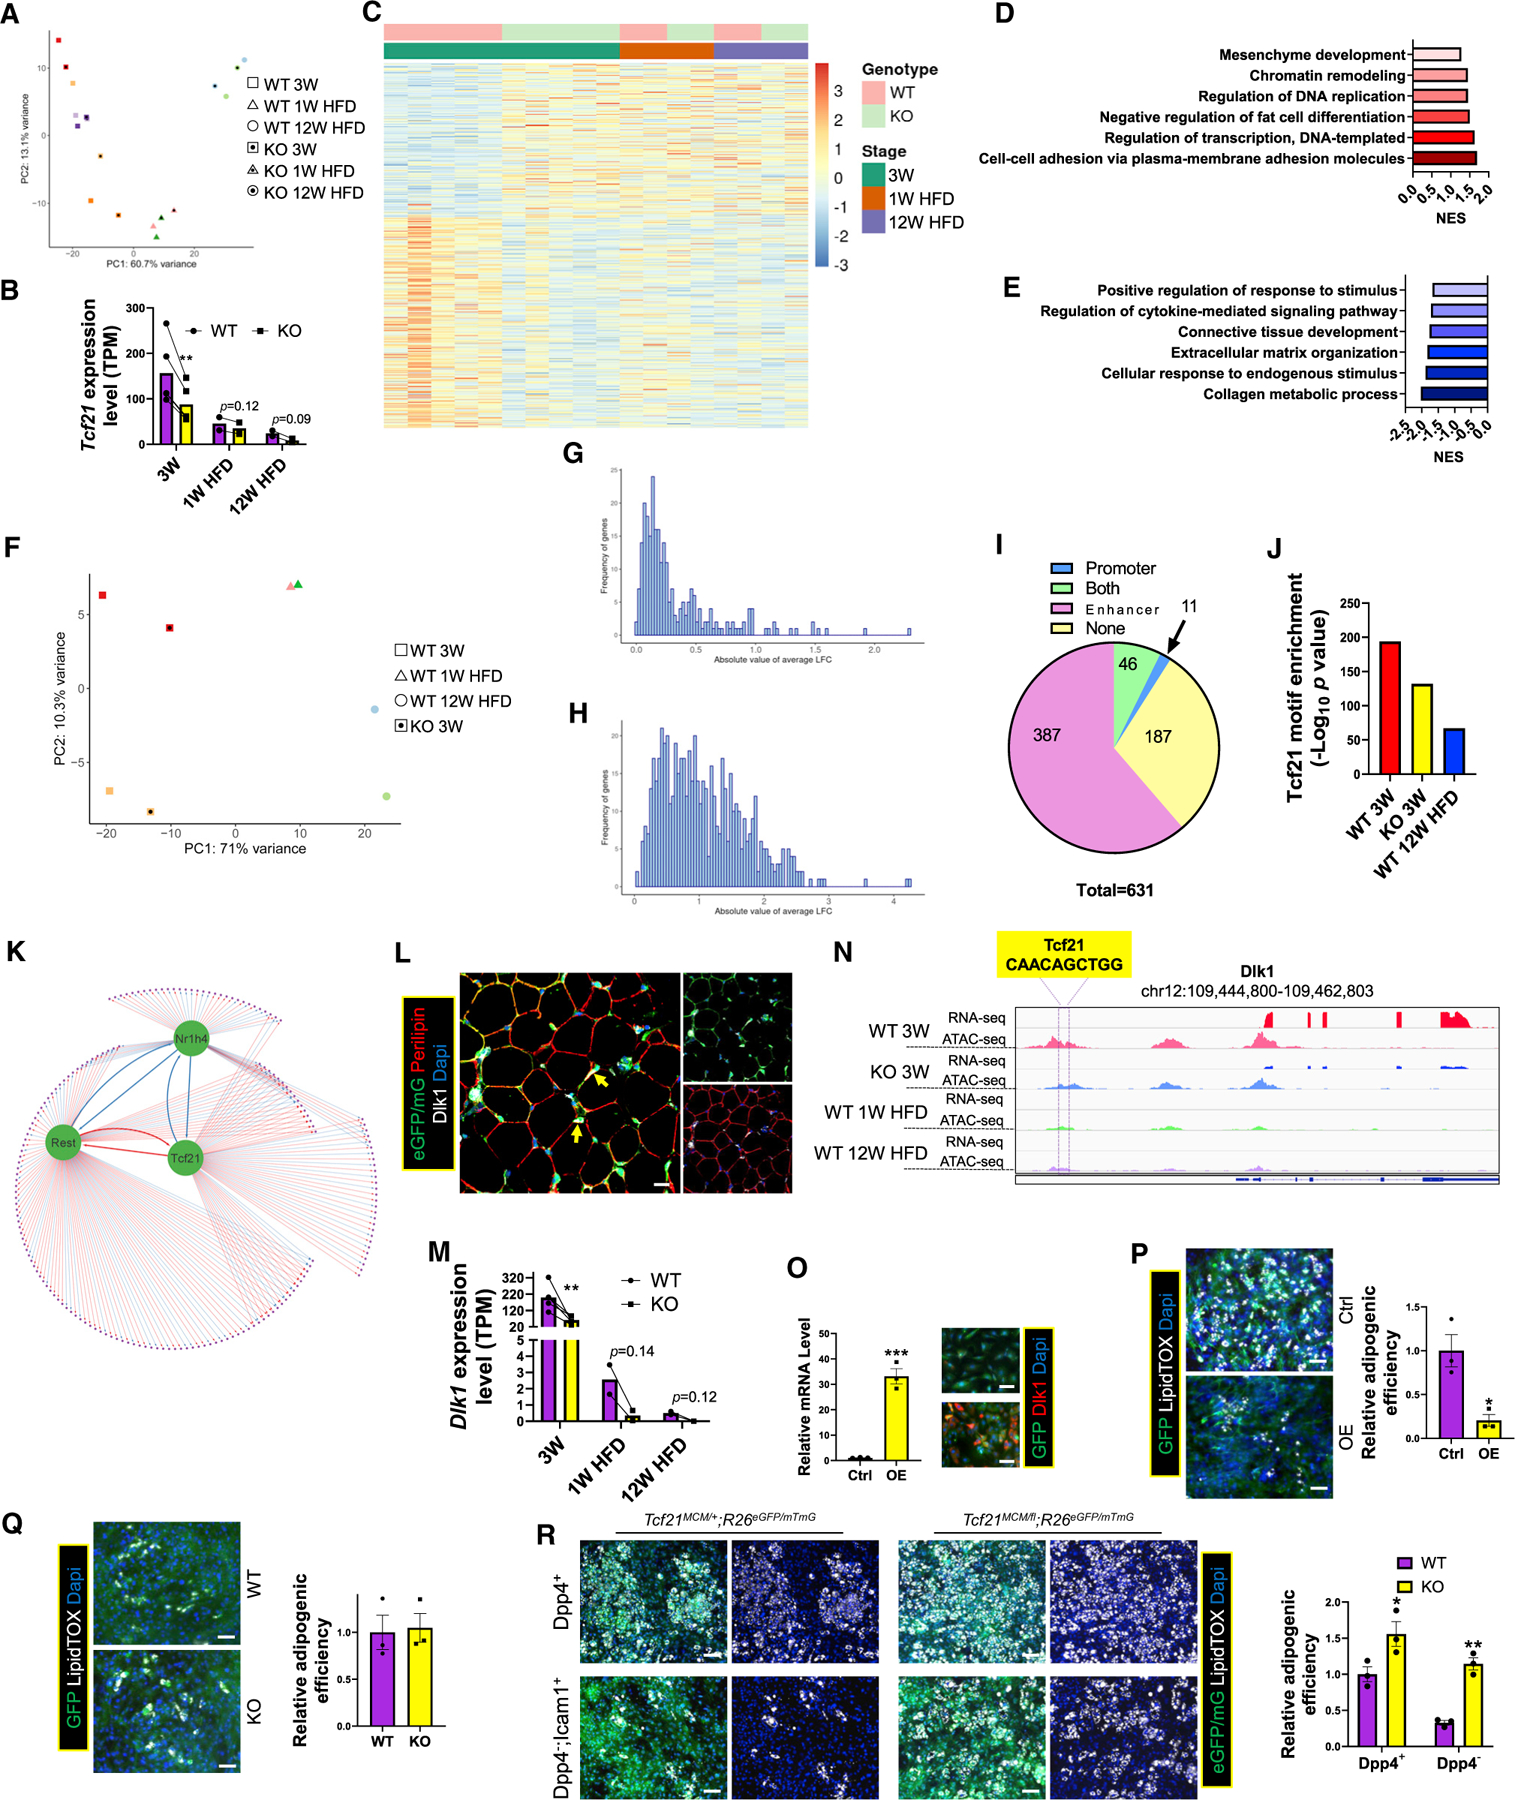
Figure 6. Tcf21 inhibits Tcf21 LC adipogenic efficiency through promoting Dlk1 expression.

(A) Tcf21 LCs from eVAT of KO mice of the indicated groups were subjected to bulk RNA-seq and PCA. Samples of the same color indicate littermates.
(B) A bar graph shows Tcf21 expression in the indicated groups. n = 5 for 3 weeks; n = 2 for 1 week HFD and 12 weeks HFD; paired t test. Data are represented as mean with values of littermates connected.
(C) A heatmap shows the expression of DEGs between Tcf21 LCs of WT and KO 3-week mice in cells of the indicated groups.
(D and E) Graphs show the NES (normalized enrichment score) of representative BPs enriched in DEGs that were upregulated (D) or downregulated (E) in 3-week WT versus KO mice.
(F) Tcf21 LCs isolated from eVAT of the indicated groups were subjected to ATAC-seq and PCA. Samples of the same color indicate littermates.
(G–I) The absolute LFC in promoter (G) and distal region (H) accessibility of DEGs between Tcf21 LCs of 3-week WT and KO mice are plotted. A pie graph (I) shows the numbers of DEGs with corresponding DAPs, DADs, DAPs and DADs, or none. See also Table S6.
(J) The enrichment of the Tcf21 motif in ADRs in Tcf21 LCs of the indicated sample groups.
(K) A GRN was constructed using direct target genes of Tcf21 and 2 Tcf21-targeted TFs. See also Table S7.
(L) eVAT of P12 Tcf21 LT mice was subjected to IHC to identify Dlk1+ Tcf21 LCs (yellow arrows). Scale bar, 20 μm.
(M) The expression of Dlk1 in eVAT Tcf21 LCs of the indicated groups was measured by RNA-seq. n = 5 for 3 weeks; n = 2 for 1 week HFD and 12 weeks HFD; paired t test.
(N) The Integrative Genomics Viewer view shows the expression and chromatin accessibility of Dlk1 in Tcf21 LCs of the indicated sample groups.
(O and P) SVCs isolated from 3-week C57BL/6 mice were transduced with IRES-GFP (Ctrl) or Dlk1-IRES-GFP (OE) retroviruses, verified for Dlk1 OE by real-time PCR and ICC (O), and induced for adipogenesis followed by LipidTOX staining (P). n = 3; unpaired t test. Scale bar, 20 μm.
(Q) Tcf21 LCs sorted from 3-week WT and KO mice were transduced with Dlk1-IRES-GFP retroviruses and induced for adipogenesis, followed by LipidTOX staining. n = 3; unpaired t test. Scale bar, 20 µm.
(R) Dpp4+ and Dpp4−;Icam1+ Tcf21 LCs isolated from 3-week WT and KO mice were induced for adipogenesis and stained with LipidTOX. n = 3; unpaired t test. Scale bar, 50 μm.
*p < 0.05, **p < 0.01, ***p < 0.001. Data are represented as mean with values of littermates connected (B and M) or mean ± SEM with individual values plotted (O–R). See also Figure S5 and Tables S6 and S7.
