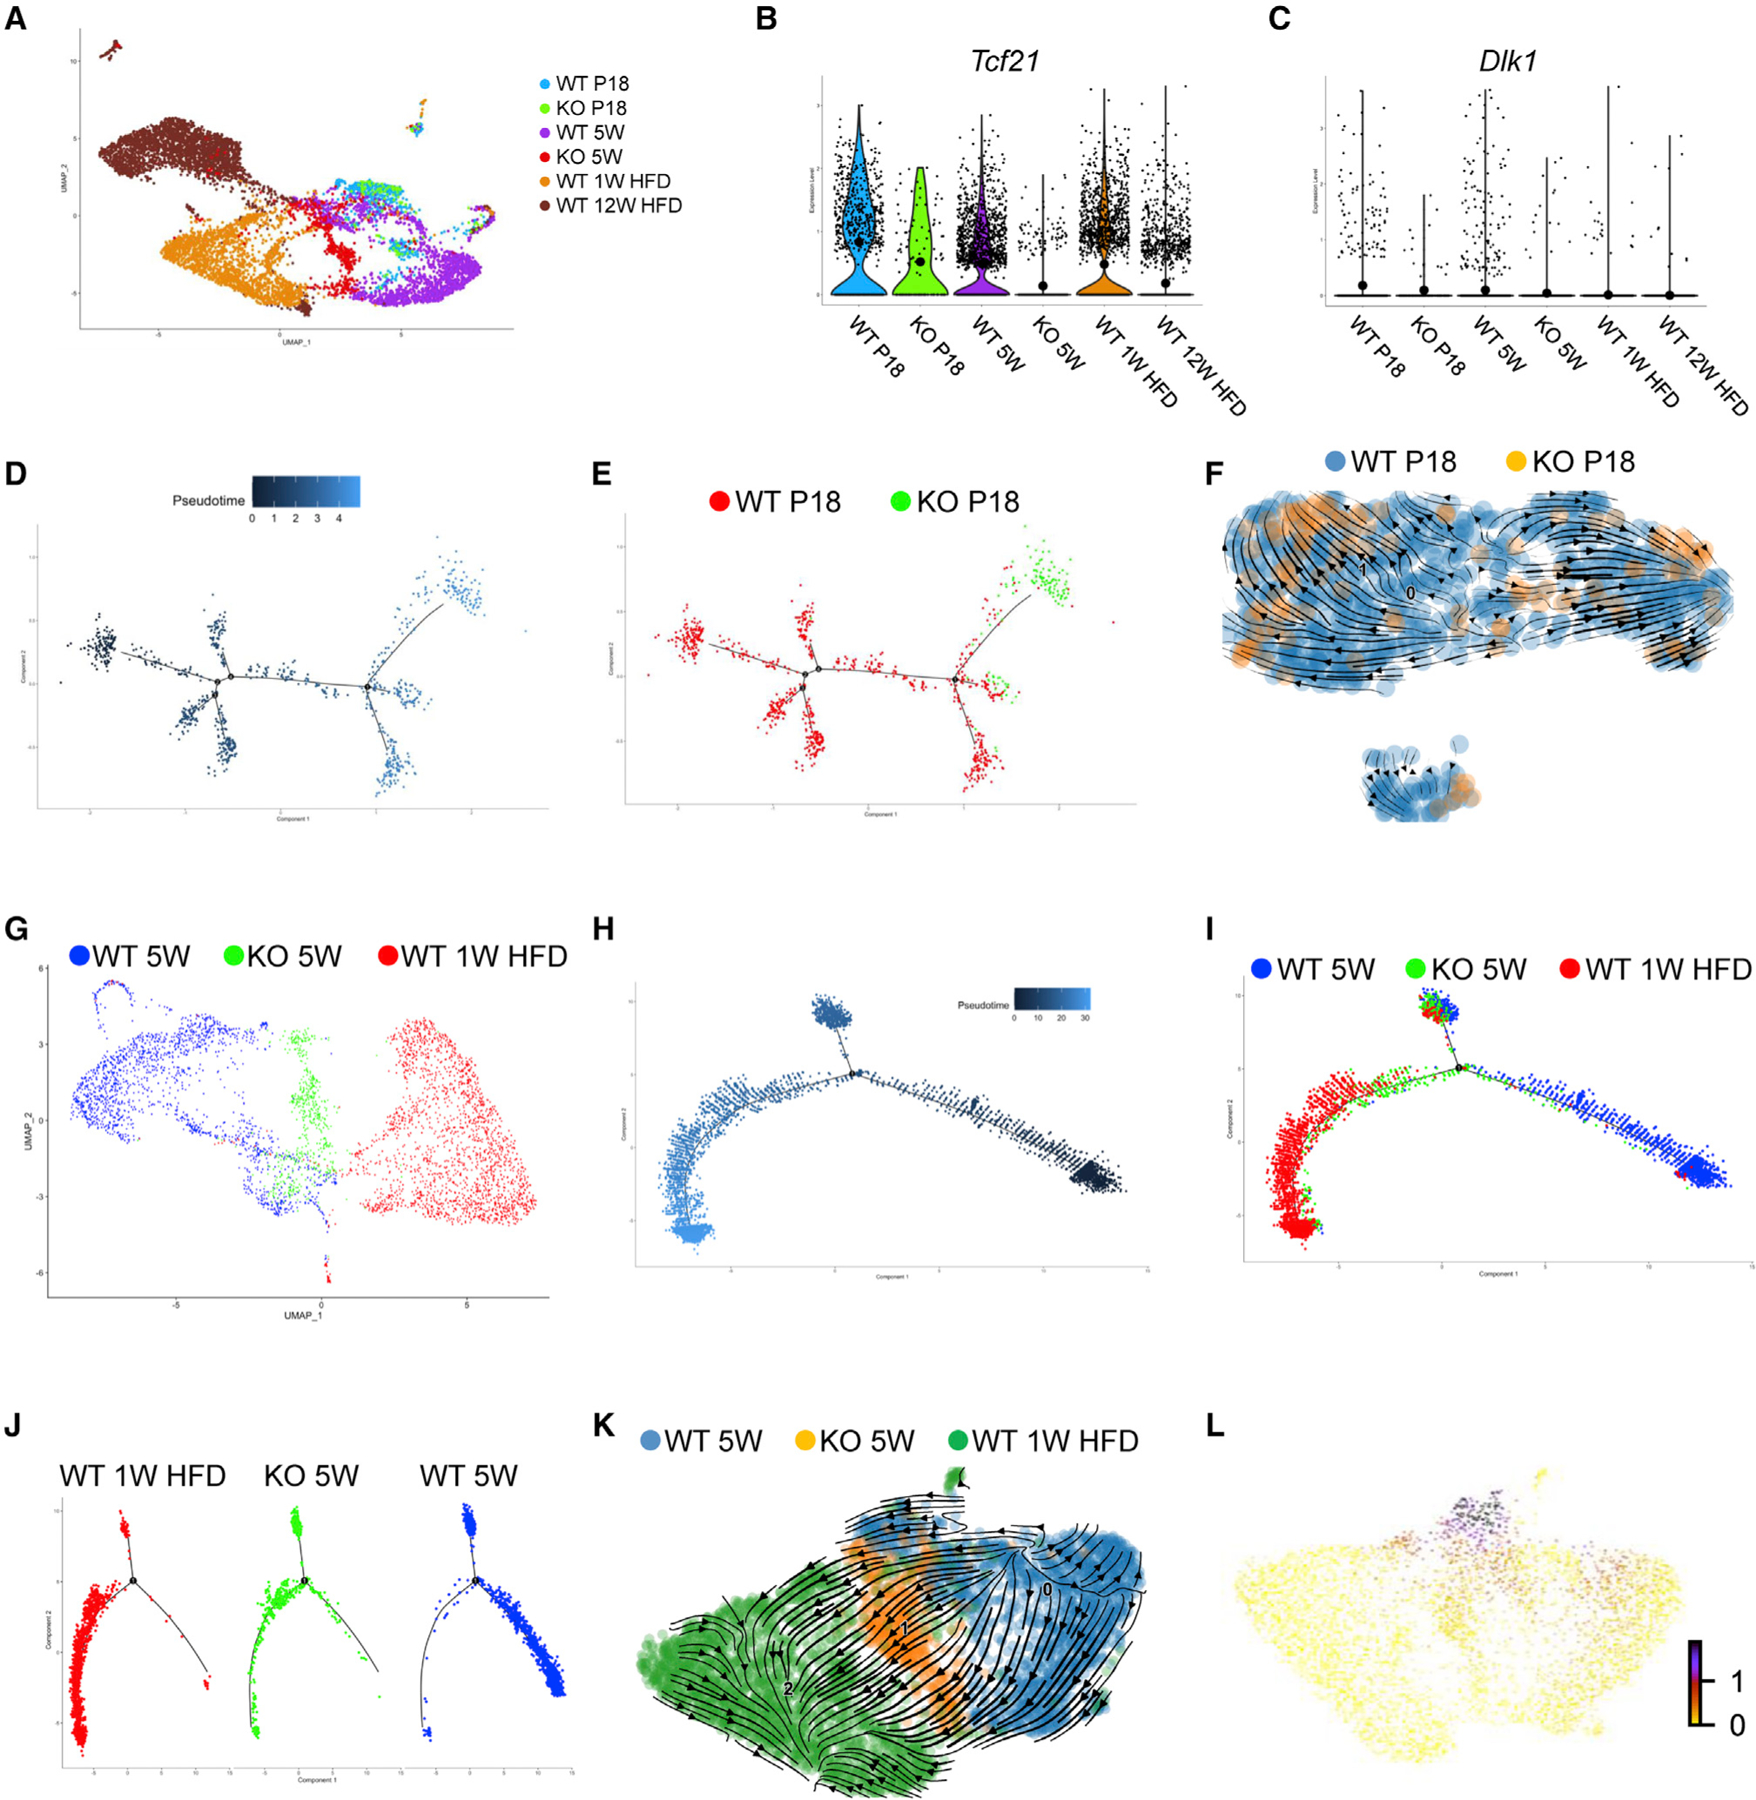
Figure 7. Loss of Tcf21 accelerates Tcf21 LC developmental progress.

(A) Tcf21 LCs isolated from WT and KO mice at P18, 5 weeks, 1 week HFD (WT only), and 12 weeks HFD (WT only) were subjected to scRNA-seq. The UMAP graph shows the clustering of Tcf21 LCs from different sample groups, which include 7,260 WT cells, 122 KO cells at P18, and 555 KO cells at 5 weeks.
(B and C) Violin plots show the expression of Tcf21 (B) and Dlk1 (C) in Tcf21 LCs of different samples.
(D and E) Monocle 2 pseudotime analysis of WT and KO Tcf21 LCs at P18.
(F) RNA velocity analysis of WT and KO Tcf21 LCs at P18.
(G) A UMAP graph shows the clustering of Tcf21 LCs of WT and KO 5-week mice and WT 1 week HFD mice.
(H and J) Monocle 2 pseudotime analysis of Tcf21 LCs of WT and KO 5-week mice and WT 1 week HFD mice.
(K and L) RNA velocity analysis of Tcf21 LCs of WT and KO 5-week mice and WT 1 week HFD mice (K) and a UMAP showing the expression of Dlk1 on the RNA velocity trajectory (L).
See also Figures S6 and S7.
