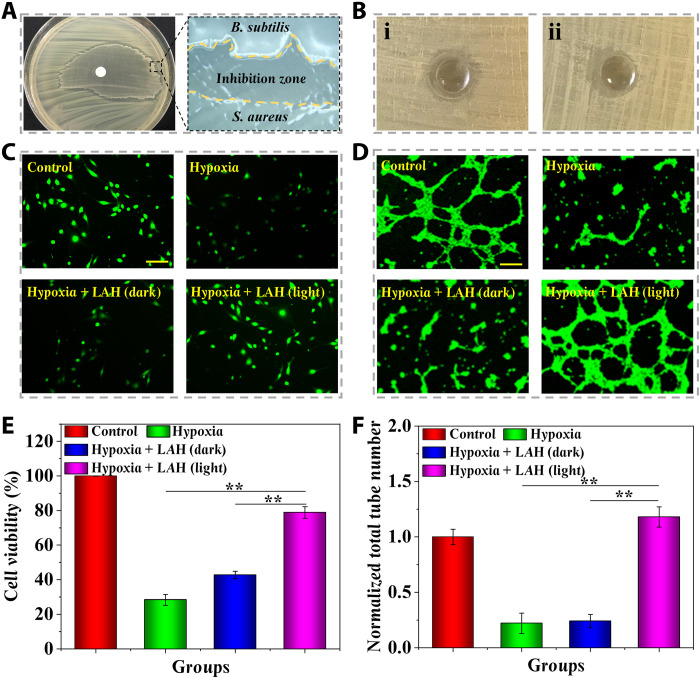
Fig. 4. Antibacterial and anti-hypoxia capabilities of the LMH.
(A) Image of the inhibition zone formed between B. subtilis and S. aureus. (B) Inhibition zone formed by (i) LBH loaded with simple B. subtilis and (ii) LMH loaded with both B. subtilis and Chlorella. (C) Representative photographs of L929 fibroblasts that suffered from hypoxia in different treatments. (D) Representative photographs of the tube formation of HUVECs that suffered from hypoxia in different treatments. (E) Statistical analysis of the cell viability of L929 fibroblasts that suffered from hypoxia in different treatments. (F) Statistical analysis of the tube formation of HUVECs that suffered from hypoxia in different treatments. Scale bars, 200 μm (C and D). n = 6 per group (E and F). **P < 0.01.

