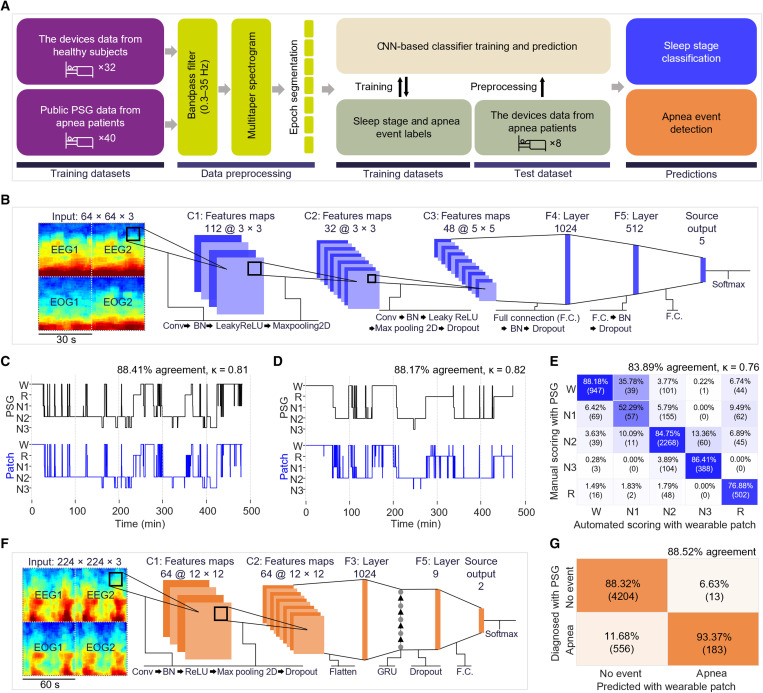
Fig. 6. Automated sleep scoring and quantitative diagnosis of sleep apnea using CNN.
(A) Flow chart illustration for an overview of the data processing and machine learning implementation for sleep scoring and apnea event detection. (B) Input data structure and machine learning architectures for automated sleep stage scoring (Conv, convolution; F.C., fully connected layers; BN, batch normalization). (C and D) Hypnograms comparing manual scorings done by a sleep technologist with the PSG signals (black) and CNN-based automated sleep scoring done with the devices’ signals (blue) over two subjects’ sleep measurements. (E) Confusion matrix showing high agreement between the manual scorings done by a sleep technologist with PSG signals and automated sleep scoring with the devices’ signals over all the eight subjects’ sleep measurements. (F) Input data structure and proposed machine learning architectures for apnea event detection (GRU, gated recurrent unit). (G) Confusion matrix showing high accuracy of apnea event detection with our system in comparison with the manual diagnosis by a sleep technologist with PSG.

