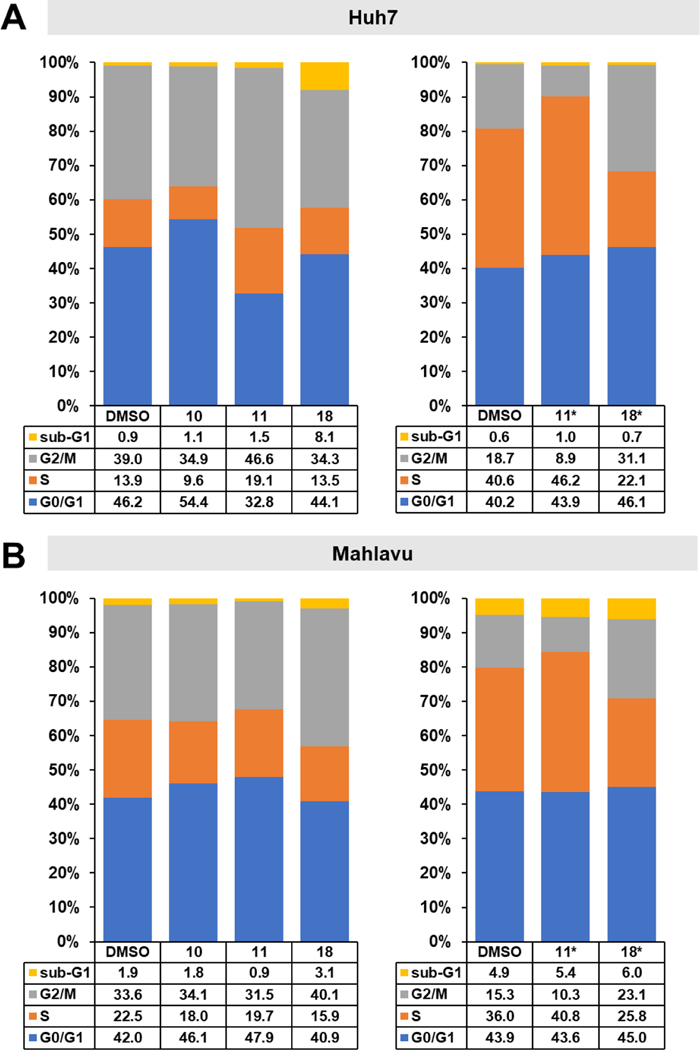
Figure 4.
Effects of selected compounds on cell cycle of HCC cells. a) Cell cycle analysis of Huh7 and b) Mahlavu cells after treatment with compounds 10, 11, and 18 and DMSO controls following 72 h of treatment with either the corresponding IC50 values (Huh7, 10: 1.0 μM, 11: 0.6 μM, 18: 0.6 μM, Mahlavu, 10: 2.7 μM, 11: 3.4 μM, 18: 2.9 μM) or with 10 μM concentrations (indicated with *). Results are represented as stacked column charts indicating different phases of the cell cycle.

